Joachim Köppen Kiel June-August 2014
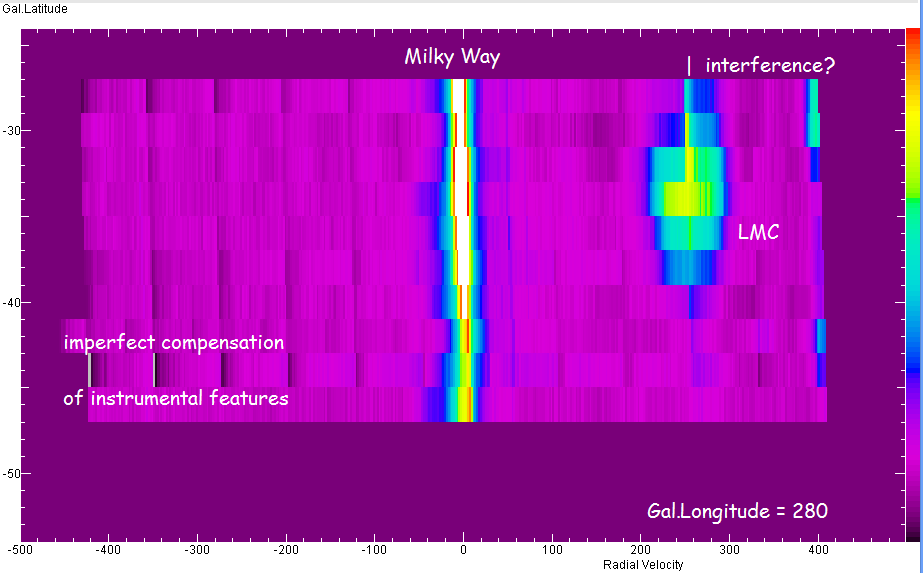
Each position was observed for about 4 hours, with a frequency span of 4 MHz. This involved stitching together 11 spectral segments, each of which had to be corrected for deviation from a flat spectrum. However this compensation depends on temperature and apparently also on frequency, this correction was optimized for the part of the overall spectrum which contains emission features from the Clouds, i.e. radial velocity 0 ... 300 km/s. There are spectra which also suffer from what looked like radio interference, giving rise to a narrow feature near 1419.9 MHz (near 300 km/s). Several positions were re-observed, yielding much better results. A few rare and very weak radio signals were indeed found, but eventually the features labelled 'interference' turned out to be artifacts from the segment stitching, which deserves to be improved. But as these artifacts do not upset the results, some of them have been left in place. All data are roughly calibrated in terms of antenna temperature, assuming a system temperature of about 170 K.
All observations were done in June and July 2014, getting about 300 data sets of 4 hours duration (and 1.7 MB file size). All raw data were reduced - flatness compensation, subtraction of the 'baseline' of the receiver's noise background, correction for the true radial velocities - using appropriate self-developed software. Taken all together, this is a very nice way to pass two months, checking the telescope twice a day, and having the suspense and the fun to see what the next data files would bring ...
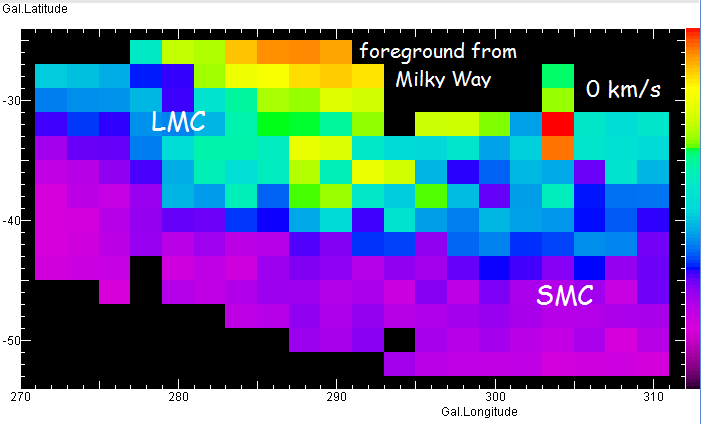
The longitude-latitude map (at 0 km/s radial velocity) and the velocity-latitude maps show the positions of the LMC and SMC:
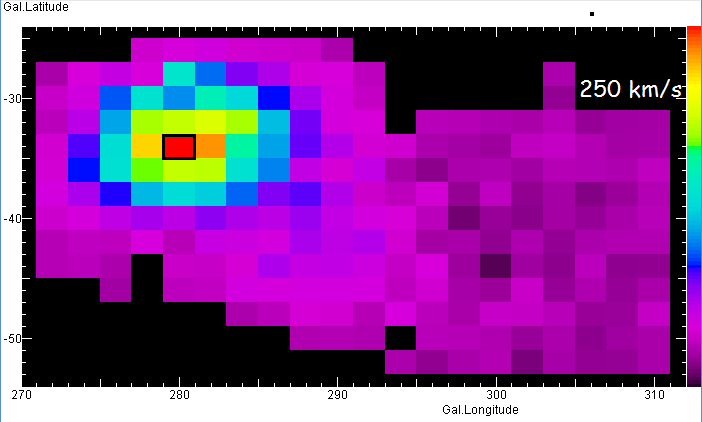
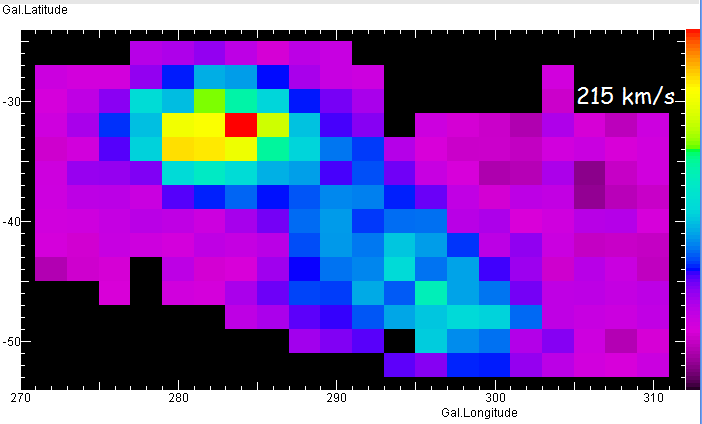
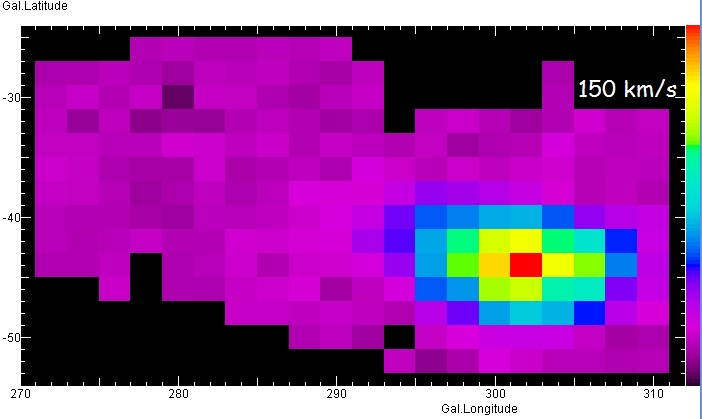
The galaxies and the gaseous bridge are visible in longitude-latitude maps taken at different radial velocities (from left to right: 250 km/s (LMC), 215, 150 (SMC)):
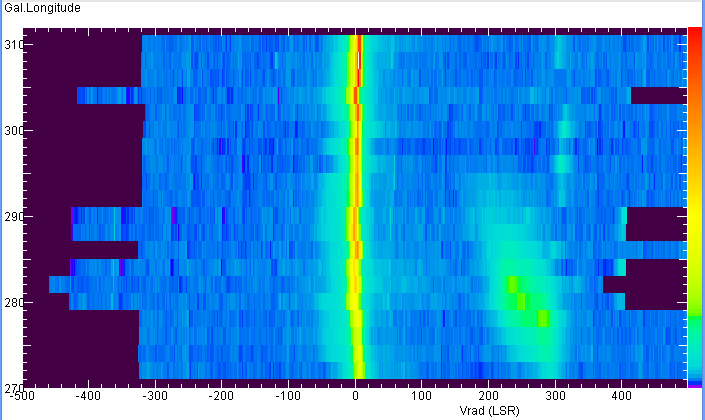
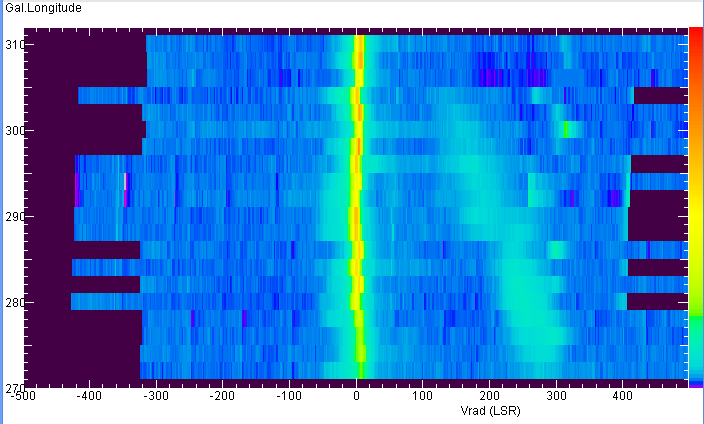
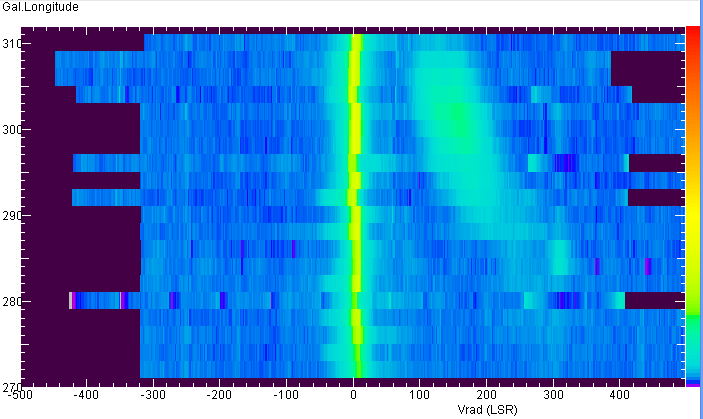
The gaseous bridge between the galaxies is best seen in position-velocity maps, where it can be followed by inspecting the change with the other positional coordinate (here: at latitudes -34°, -38°, and -42° (left to right)). The bright narrow band in the centre (near 0 km/s radial velocity) is the foreground emission from our own Milky Way.
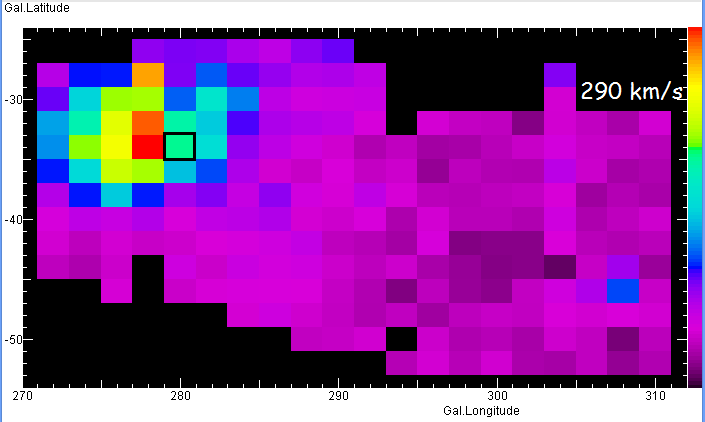
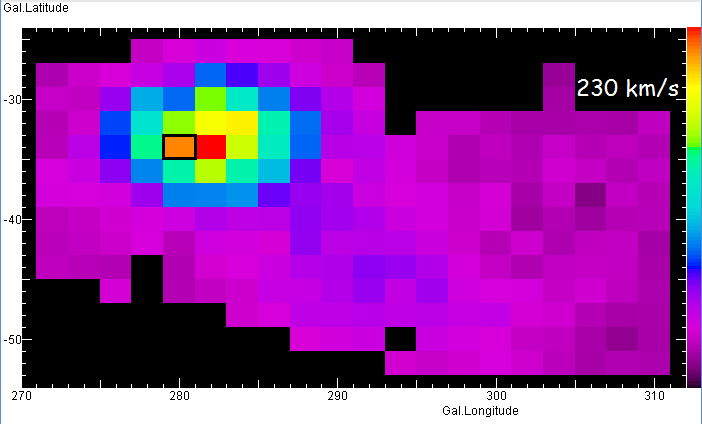
A closer look reveals that the emission varies over the face of the LMC in a systematic way: The 'left' side flies faster from us than the 'right hand' side (from left to right: 290, 250, and 230 km/s, the small square marks the LMC centre). This shows that this galaxy rotates around its axis, like our Milky Way and other galaxies:
The data are in a data cube of galactic longitude (from 270° to 310° in steps of 2°), galactic latitude (from -54° to -24° in steps of 2°), and radial velocity from about -400 to +400 km/s. False colour Maps of the antenna temperature as a function of any two of the three parameters are shown for a fixed value of the third parameter. Also, Plots in one of the parameter can be done, for fixed values of the other two parameters. The applet below allows inspection of the complete data cube in any detail.
| to my Applets | to my HomePage |
last update: July 2014 J.Köppen