Survey of the Galactic Plane
Joachim Köppen Strasbourg 2010
As the ESA-Haystack telescope operates on 21 cm, its principal application is the investigation of the distribution of neutral hydrogen gas in the Milky Way, and to study its kinematics. This is done by systematic observations of the spectra taken in the Galactic Plane. From our geographical position, it is possible to cover Galactic Longitudes between l=0° and l=250°, almost 70 percent of the Galactic Equator. As the antenna's beamwidth is about 6°, if suffices to record spectra every 5° in longitude - although it is no waste of time to do in with a finer spacing! Either in manual mode or in batch mode one records at each position the spectra, say for a couple of minutes, during which a sufficient number is obtained to get a good average spectrum.
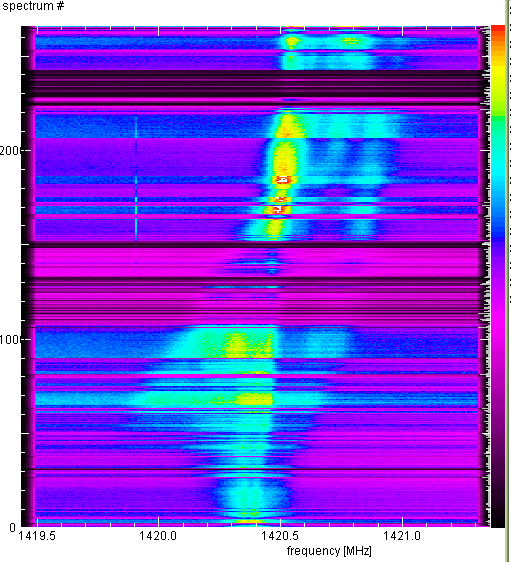
An example of such a batch observation (during the night of 15 july 2009) is shown below, first in the form of a waterfall map of the raw data

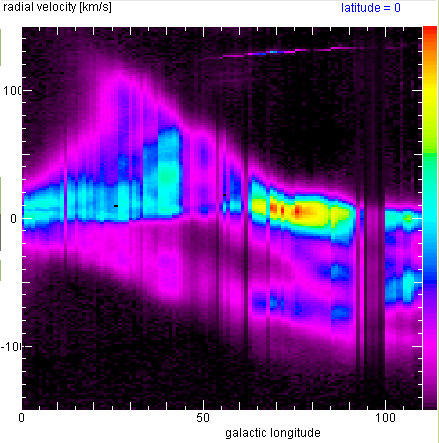
If one averages all the spectra taken at each position, and then creates a false colour plot of the radial velocities and galactic longitudes:

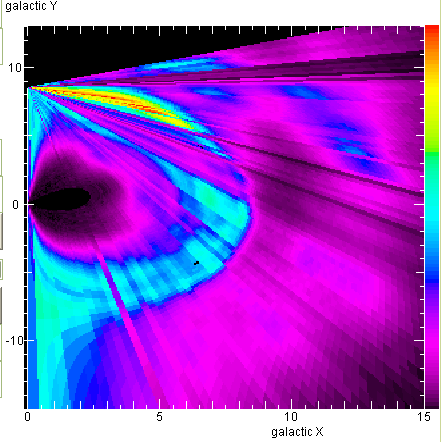
If one uses a reasonable approximation for the rotation curve, one may use the radial velocities of each component as an indicator of the distance of the emitting region from the Sun, and reconstruct the true distribution of neutral hydrogen in the Galactic Plane with its spiral arms:

Following the successful use of band-pass filters in spring 2010 we started a complete survey of hydrogen emission in the Milky Way.
| Top of the Page | Back to the MainPage | to my HomePage |
last update: Nov. 2010 J.Köppen