Receiver Noise Figure and Zenith Attenuation from Skyprofile Measurement
Joachim Köppen DF3GJ ... Kiel Oct 2022
Some brief explanations
This tool interprets measurements of the radio noise of the empty sky, taken at various elevations (skyprofile, tilt-down, tilt-up) and determines the receiver noise figure (or system temperature) and the zenith attenuation (or temperature).
There are a number of example data from various telescopes and frequencies. They may be modified by altering the data in the green text fields.
Enter the elevations and your measured data, as well as the ground noise, in the green textfields. They can be given either in deciBel or linear power units, but obviously on the same scale. Hit the Enter key to display the data as blue dots in the diagram.
The ground noise can be obtained by pointing the antenna deep enough to the ground so that it fills completely the antenna beam. Alternatively, one can point to the wall of a house or a large and dense tree or bushes. If you do not have a measurement of the ground noise, the best match relies only the shape of the curve. This may be quite close.
In order to obtain reliable values for the zenith attenuation, the measurement of low elevation angles is essential to cover the curved part of the plot. Thus, measurements with wide antenna beams - such as the feed antenna - are not able to provide trustworthy results.
Enter your guess values for receiver noise figure and zenith attenuation, and hit the Enter key. A red curve shows the prediction from this model. Adjust the guess values until a good agreement is reached.
The mean radiating temperature Tmr of the air can be chosen as 290 K or as 275 K (recommended by ITU-R P.372-15 for clear and rainy weather) or estimated from the surface temperature (ITU-R P.372-15 for clear and cloudy weather).
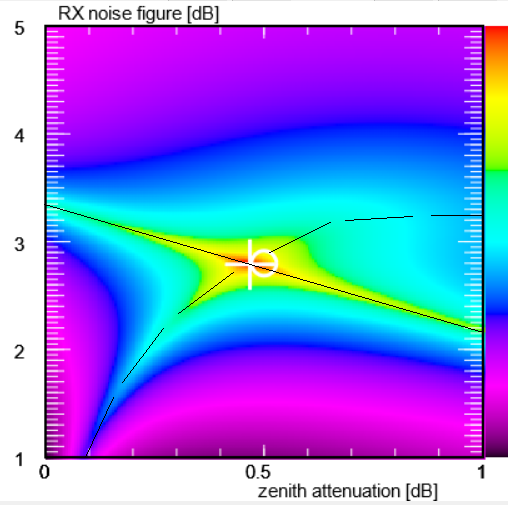
At the same time, the false colour map on the right side displays the goodness of the fit between model and data, as a function of receiver noise figure and zenith attenuation for the range of values indicated on the x- and y-axes. The goodness of fit is derived from the difference between model and data, and is displayed by colours from magenta (poor fit) to orange and red (best fit). The optimum fit is marked by a white cross, and the best parameter values are displayed below the map, both in dB and in temperatures.
|
Please note: Normally, the best fit is reached at the intersection of the curve which represents the fit of the sky measurements and the straight line running down from the upper left - which shows the match of the sky and the ground noise. If the best fit does not lie on this straight line, this indicates that sky and ground measurements are inconsistent. Perhaps something went amiss with one of the measurements ... try changing slightly a value. |
If you specify the Error bar of measured data, only those parts in the map are displayed with colours in which the fit curve matches all data points within this error. The size of this colour region allows you to estimate the error bar on the best fit results.
A white circle indicates the guess values entered below the plot. The button 'Show best fit' displays the best solution in the plot.
When parameters are used that are outside the validity for the approximations used in this tool, corresponding fields are marked yellow.
The mouse position gives the coordinates of that point, allowing to read numerical values from the plot.
The frequency is not essential for the analysis. It is merely used for display.