
When we perceive the colour of an object, our visual system besically compares the contributions of light of different wavelength. If the longer wavelengths dominate, the object has a redder colour. In the same way we can build an instrument which measures colour:
We use a photometer to measure the light intensity either without or with a colour filter placed in front of the sensor. Suppose this filter is a red filter. When we shine white light on the photometer, we shall get two readings of the resistance of the photoresistor:
- without filter: R_white
- with red filter: R_red
Now let us repeat the measurements with red light, such as by placing a filter of red plastic foil in front of our light source. Then the light will no longer contain the blue spectral part, and therefore the two measurements will give almost the same values, or the ratio R_red/R_white will go down, near to 1.0.
If we perform the experiment with green or blue light, the photometer without red filter will receive all the light available, but with the red filter it will receive much less, so the ratio R_red/R_white goes up!
In this fashion, the ratio R_red/R_white of the resistances is a measure of the redness or blueness of the light!
Instead of doing measurements by placing a colour filter in front of a single photometer, we can use two photosensors, placed side-by-side, and shown below. The two tubes of black cardboard serve as collimators, so that the sensors can be pointed towards an object to analyse its light, without confusion from light coming from other directions.
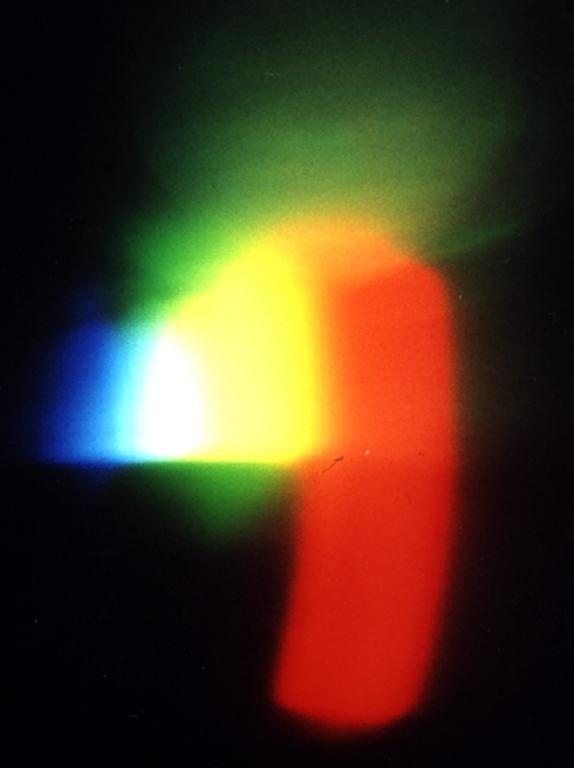
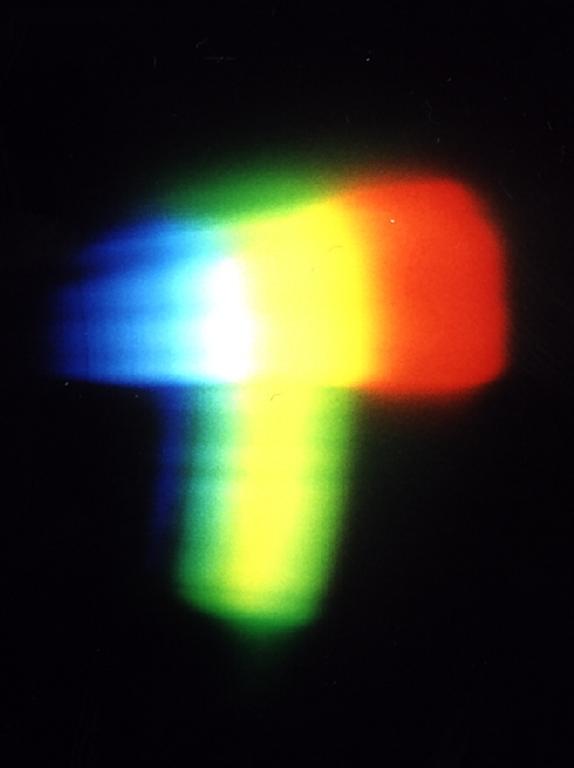
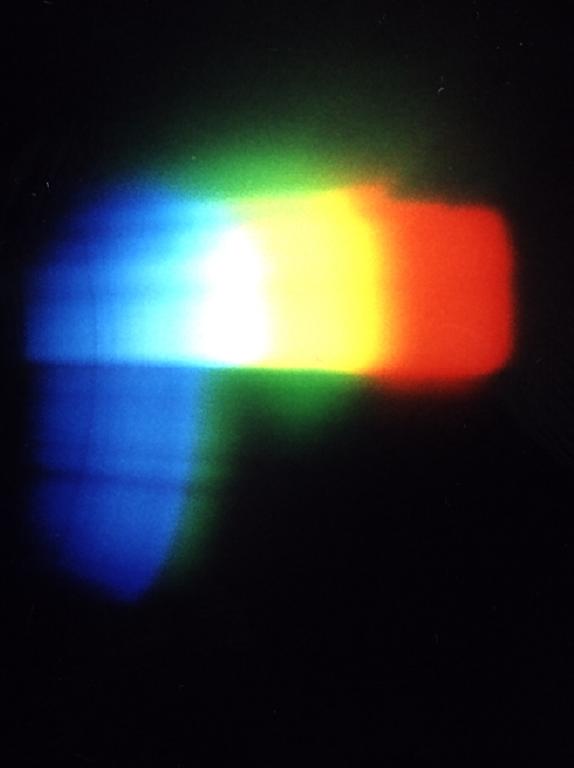
The choice of the colour filter(s) determines the quality of the measurements. Ideally, a filter should have a sharp transition between passing through light in one range and blocking it in the other. You can easily look at the filter characteristics using the CDROM spectroscope. The following images show what spectral regions a red, green, and blue filter let pass through (below) from the white light (above):
We may use the same photosensor, but use several different filters. For example, I used my experimental LDR Photometer making many observations of various light sources and the sky above Kiel under a great variety of conditions. Here are some of the original data. The readings were done through various filters:
- ERed: gelatine filter from Edmunds (has a sharp cut-off in the yellow)
- EGreen: gelatine filter from Edmunds (passband well limited to green, no overlap with red filter)
- EBlue: gelatine filter from Edmunds (good passband in the blue, but some leakage in the red and perhaps in the infrared)
- Red: plastic foil (green and blue still shine through)
- Yellow: plastic foil (all other colours come through)
- Blue: plastic foil (all other colours come through)
- darkBlue: from plastic container for raspberries (pretty dark and dull, but passband well limited to blue and a bit of green)
- IR: a bit of plastic cover from an IR remote control (when looked through, one notes a dull violet tinge, but tests with an IR LED and IR phototransistor show good IR transparency)
In the table below, all resistances are given in kOhm.
| Source | White | ERed | EGreen | EBlue | Red | Yellow | Blue | darkBlue | IR |
| Tungsten Lamp | 1.1 | 1.9 | 23.5 | 4.4 | 1.6 | 1.4 | 2.1 | 33.8 | 9.0 |
| Fluorescent Lamp | 16.9 | 42.8 | 400 | 900 | 28 | 23 | 60 | 630 | 4000 |
| direct Sun | 0.016 | 0.030 | 0.122 | 0.60 | 0.023 | 0.020 | 0.026 | 0.127 | 0.120 |
| morning Sky | 3.7 | 14.2 | 44.0 | 40.5 | 7.9 | 5.7 | 8.0 | 30.0 | 90.5 |
| Snow | 1.0 | 2.7 | 12 | 7 | 1.8 | 1.47 | 2.16 | 11.8 | 17.7 |
| Dawn | 13.0 | 44 | 165 | 135 | 26 | 19 | 28 | 129 | 310 |
| blue Sky | 2.4 | 11.3 | 28 | 30 | 5.5 | 3.9 | 5.2 | 18.2 | 75 |
The following table shows more mesurements, but here all columns show already the ratio of the measured resistance and the 'white' resistance. Also, they have been arranged in order of increasing R_red/R_white. Note that the description in the first column gives simply my own impression.
| Source | White | ERed | EGreen | EBlue | Red | Yellow | Blue | darkBlue | IR |
| Tungsten Bulb | 1 | 1.6 | 20 | 3.9 | 1.4 | 1.2 | 1.8 | 30 | 7.9 |
| direct Sun | 1 | 1.8 | 9.0 | 3.8 | 1.4 | 1.2 | 1.7 | 10.5 | 7.4 |
| rosy Sky | 1 | 2.1 | 13.6 | 5.9 | 1.6 | 1.3 | 1.9 | 13 | 11 |
| Fluorescent Lamp | 1 | 2.7 | 24 | 53 | 1.6 | 1.4 | 3.6 | 37 | 240 |
| grey Sky | 1 | 2.8 | 14.6 | 7.4 | 1.8 | 1.5 | 2.2 | 12.7 | -- |
| white Sky | 1 | 2.9 | 15 | 7.8 | 1.8 | 1.5 | 2.3 | 12.7 | -- |
| Snow | 1 | 3.3 | 16 | 9.6 | 2.2 | 1.7 | 2.4 | 14.5 | -- |
| blue Sky | 1 | 3.5 | 12.6 | 10 | 2.1 | 1.6 | 2.2 | 9.3 | 23.5 |
| light blue Sky | 1 | 3.7 | 14 | 9.3 | 2.1 | 1.6 | 2.1 | 8.9 | -- |
| dawn Sky | 1 | 3.7 | 13.5 | 11 | 2.2 | 1.6 | 2.2 | 10 | 25 |
| deep blue Sky | 1 | 4.3 | 13.5 | 10.4 | 2.3 | 1.7 | 2.1 | 7.7 | -- |
| dark blue Sky | 1 | 4.6 | 14.5 | 10 | 2.4 | 1.7 | 2.1 | 8.2 | -- |
One can already see from the table, that the bluer the sky, the larger is the ratio R_red/R_white. This is very clear with the red gelatine filter (ERed), but also the poor red filter (Red) shows the same behaviour. Neither the blue nor the green filter shows an equally clear trend. For a measurement of the blueness of the sky, it would suffice to use only two photometers, one without a filter and the other with a good red filter. If we use an additional blue channel, we are able to discriminate between the colours in a more precise way:
| Top of the Page | Back to the MainPage | to my HomePage |
last update: March 2010 J.Köppen