How to Analyse the Data
Joachim Köppen DF3GJ Kiel/Strasbourg/Illkirch Summer 2004

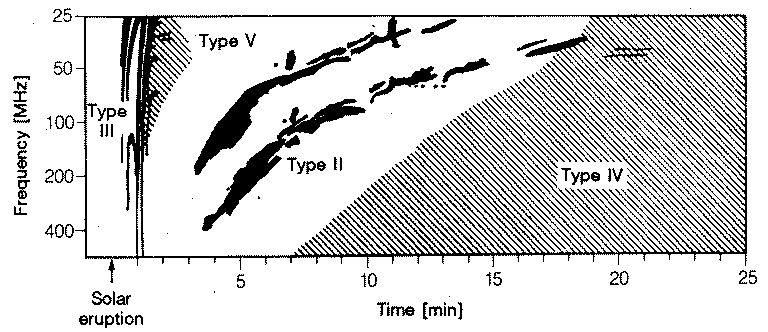
Schematic dynamic spectra of the various types of solar radio
bursts. Type II and III burst are relatively narrow-band and sweep from
high frequency to low frequencies, rapidly or more slowly; Type IV and V are
more broadband, resembling even more a broadband noise.
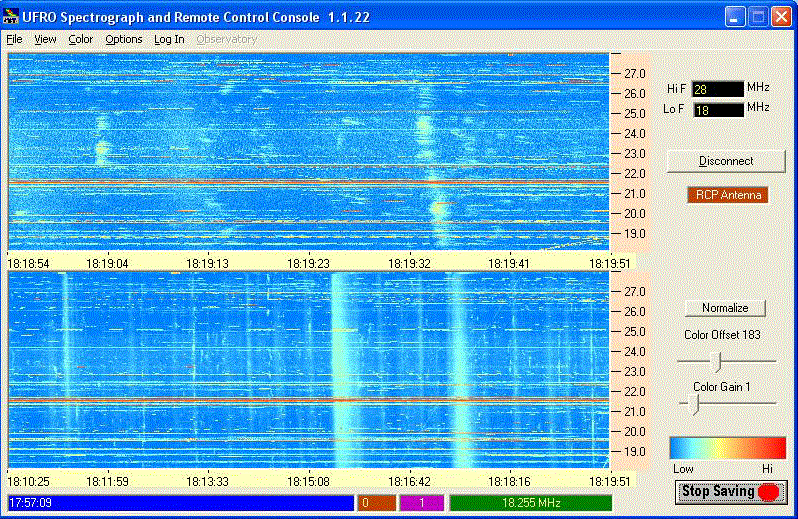
In a different orientation, such a spectrum is shown below, as observed with
the Spectrograph at the University of Florida's Radio Observatory, built by
Richard Flagg.
The observations are from March 31, 2004, and more data can be found in
the Radio Jove Data Archive.

One notes as horizontal red lines the strong emissions by the 13 m broadcast
band near 21.6 MHz, also some strong signal around 27 MHz (CB radio) and
other terestial emissions. The solar bursts are weaker (light blue), and show
up as almost vertical structures, sweeping rapidly from high frequencies down.
At a single frequency, such as 20 MHz, the amplitude of the two strong
bursts would resemble the 'shark's fin' shape of rapid rise - slow fall.
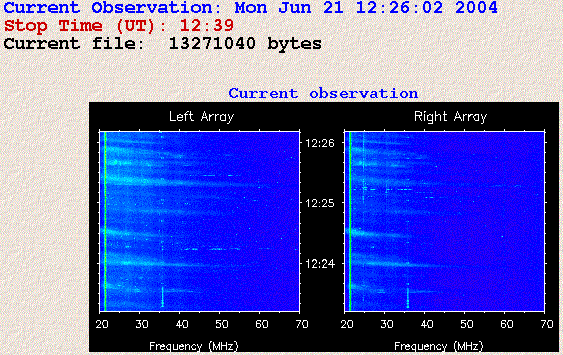
Below is a similar view, in yet another orientation, from the Nançay
Decametric Array

So what we can do with our single-frequency data:
- Compare with other's observations:
Radio Jove Data Archive
at NASA's GSFC
- Check solar radio bursts with
NOAA's Lists of Edited Solar Events for
of the day.
Archived data are found here (from june 2015 onwards)
Please note that these lists
take a few days to be in the final form. Also, they are not complete; you might
come across a radio burst the professional stations might have missed.
However, make sure that such an event is not a man-made signal or
interference...
- check with the Dynamic Spectra from the
Nançay Decametric Radiotelescope
- Compare noise temperatures with typical observations of other
people ... radio communications that might come up on the
frequency could be much more intense than a normal solar noise
storm. Likewise, strong local interference from a passing
poorly kept car might cause unnatural high signals ...
- Listen to the signals as much as you can: train yourself a bit
to distinguish the rushing noise of thermal noise from the
computer noise which may sound like a whine with several
tones superposed. Operation of faulty electric apparatus becomes
obvious when you hear it switched on and off.
Recently, I heard a gargling/throbbing sound becoming louder in
almost a rythmic way, leaving a trace on the plot a bit similar to
some complex solar radio bursts. From its sound, I recognized it
as a kind of data transmission one often hears on the short waves.
Since the sound persisted
independent of the tuning of the receiver, it became obvious:
It was that kind of data transmission, on a nearby frequency,
but so strong that it caused overload of the receiver's mixer.
Its strength varied because of fading due to the short waves
reflected by the ionosphere. If I had seen only the plot, I would
have thought of having observed an interesting radio burst...
- some solar radio bursts have a characteristic shape: noise
rising fast but decaying more slowly. In the chart they look like
shark fins. Also they have a characteristic duration of a few tens
seconds. When you look through the data, it helps to set the
time interval displayed on the screen to a suitable value, to make
it easier to spot them. You can train your eyes on the data stored
in the
Radio Jove Data Archive
| Top of the Page
| back to Main Page
| back to my Home Page
|


