Examples of RadioJove Observations
Joachim Köppen Kiel/Strasbourg/Illkirch Spring 2004
Schematic dynamic spectra of the various types of solar radio bursts.
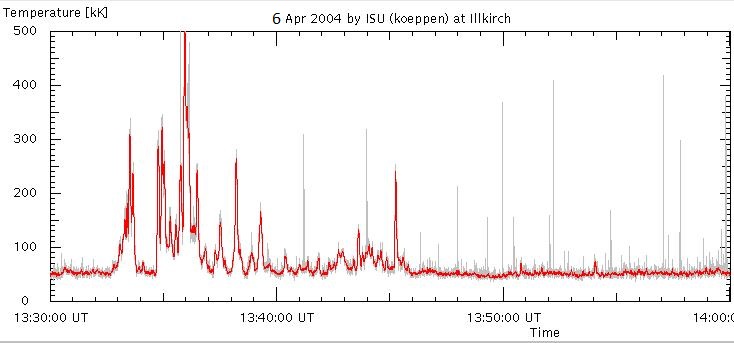
This is a nice solar burst recorded at ISU on 6 April 2004 (some images give the wrong date ... yet another bug now removed in my SkyPipePlotter program; also the times are shown as UT, but because I had not yet changed the time zone to account for summer time, thus our times are one hour late). Spikes in the data were removed, the grey curve shows the raw data:
The signal was very strong (15000 units), and exceeded the range that is covered by our calibrator (1600 units correspond to +34 dB over thermal). However, since the noise voltage increases with the square root of the temperature (see Dick Flagg's book on RadioJove, and also see Jim Sky's recommendations on extrapolating signal beyond calibration we can use this asssumption as a good approximation to extend our calibration, and we get:
We compare the main event in normal units (linear in audio voltage)
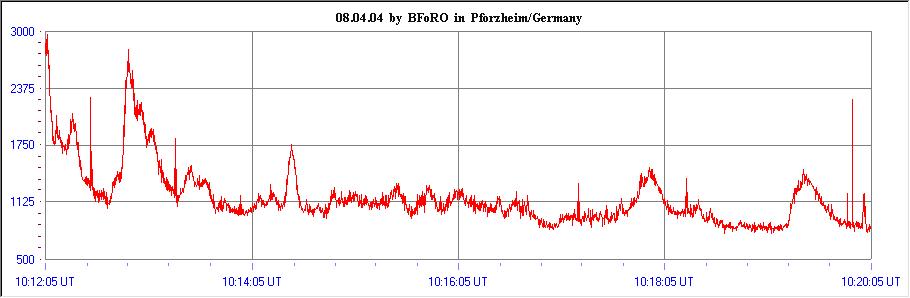
and in same time interval as recorded by George Lauffer in Pforzheim, on the other side of the Rhine:
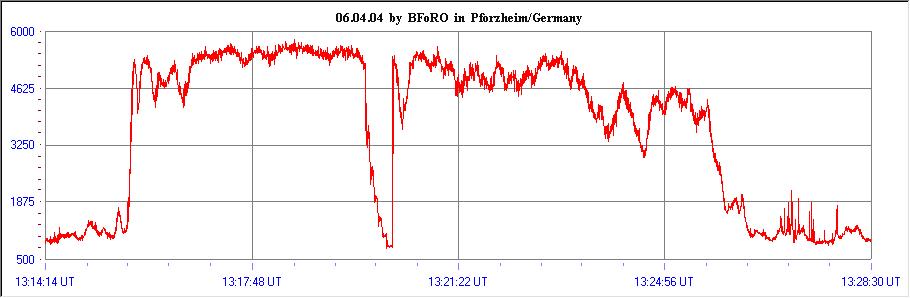
His receiver was evidently overloaded by the evidently extremely strong signals, and in the middle of the burst he did a quick calibration sequence. But when the signals are not too strong, our recorded voltage variations are very similar, thus confirming to both of us that the signal did not come from our neighbourhood. It was the solar event No. 3100 which lasted 13:09 to 14:05 UT. Just before the main event, we also notice a couple of weaker bursts, which are also listed by NOAA as from 13:09 to 13:13 UT:
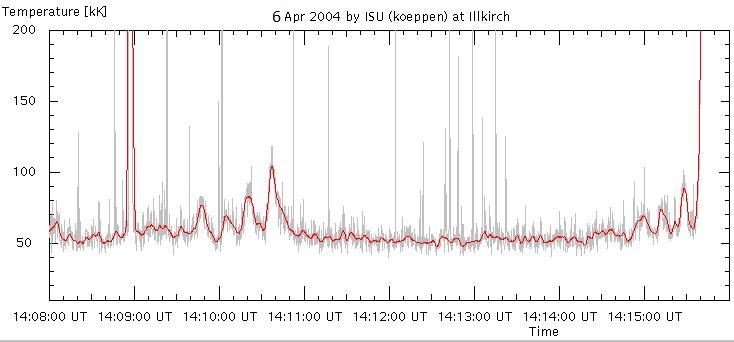
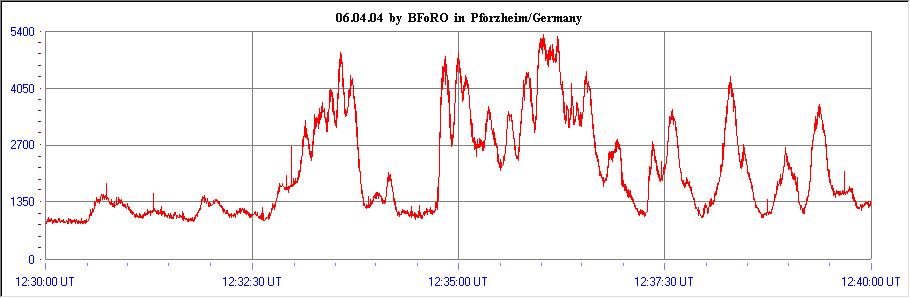
Another half hour earlier, there were already quite a few bursts which NOAA lists as also belonging to No. 3100: Our recording de-spiked and smoothed
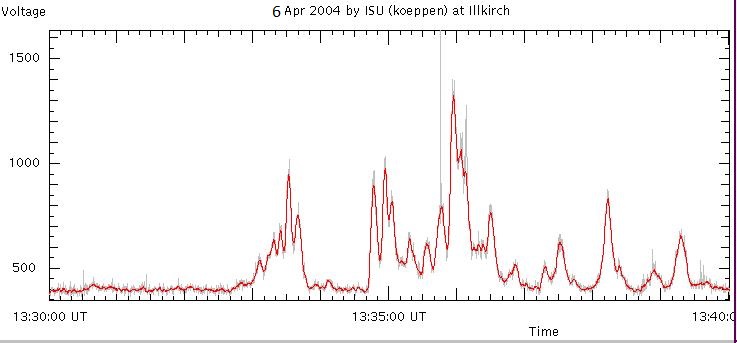
is very close to what was recorded by George Lauffer:
And here are the entire 30 minutes, in temperatures
On 8 April 2004, George Lauffer plotted this series of bursts:
which corresponds very well with what we observed:
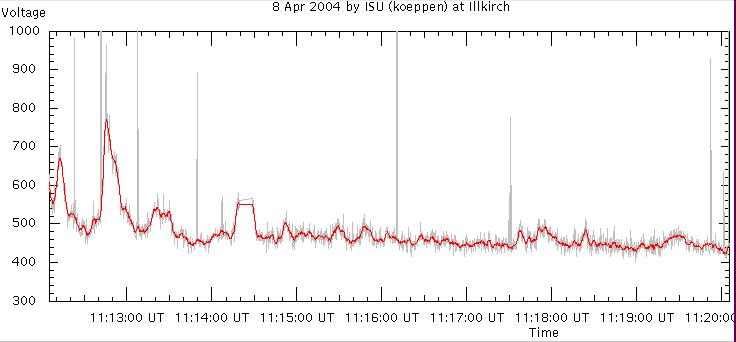
As can be seen from the clarity of the bursts at 10:18 and 10:19:30 his setup is more sensitive than ours (part of which is due to the 3 dB losses by our 20 MHz narrowband filter) and his location may not be so plagued by electronic garbage! But looking at our plot for earlier times:
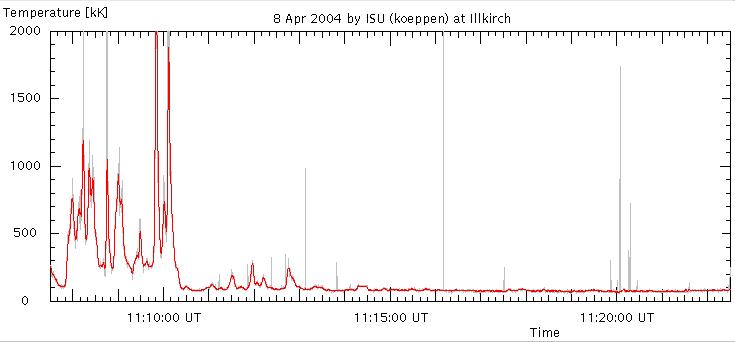
we see that there had been an even stronger event going on for a while. NOAA lists event No. 3430 as from 09:53 to 10:24 UT, which started before our above plot, so let's have a look what the previous file reveals ...
On the same day, there was a weaker event:
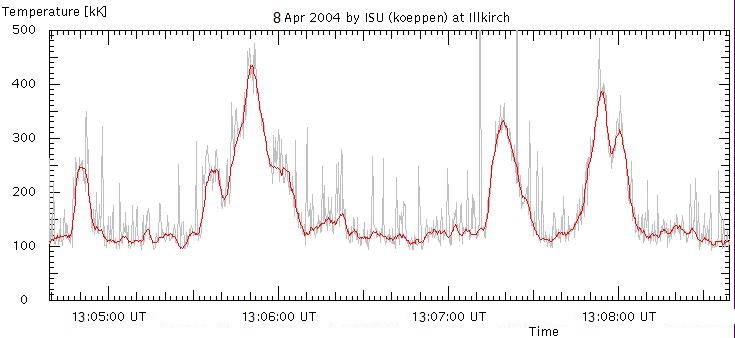
which had been observed by John Rock in England:
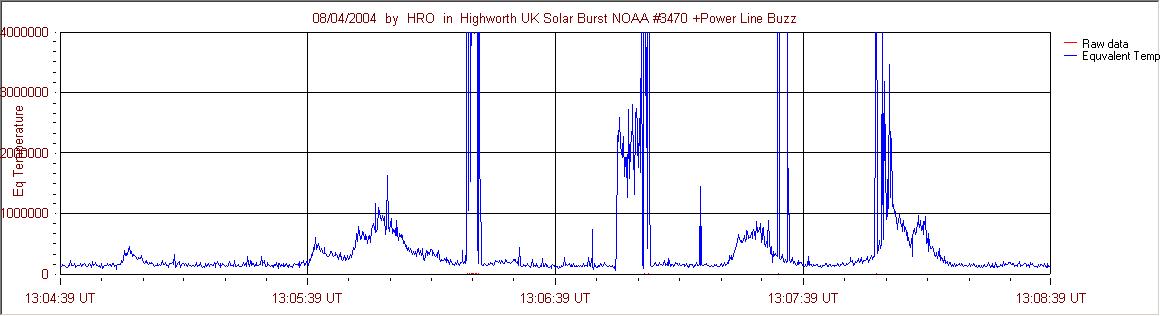
Again, our equipment is somewhat less sensitive, but luckily we did not suffer from power line buzz, though we had many weak spikes, perhaps from the computers of busy colleagues... Both stations nicely picked up the bursts of NOAA event No. 3470, a type III/1 eruption, from 13:05 to 13:08 UT. The maximum noise temperatures measured were 400 kK and 1000 kK, which reflects the differences in our equipment and the direction of the antennas. For example, the ISU aerial is oriented nearly north-south, thus we won't have the sun right at the maximum of the antenna pattern.
Here are solar bursts recorded by RadioJove receivers at NASA/GSFC and in Florida. Note that despite the numerous spikes from local lightning in Florida, the solar eruption is well detected.
| Top of the Page | back to Main Page | back to my Home Page |