BluePlotter Applet
Joachim Köppen DF3GJ Kiel/Strasbourg/Illkirch July 2004
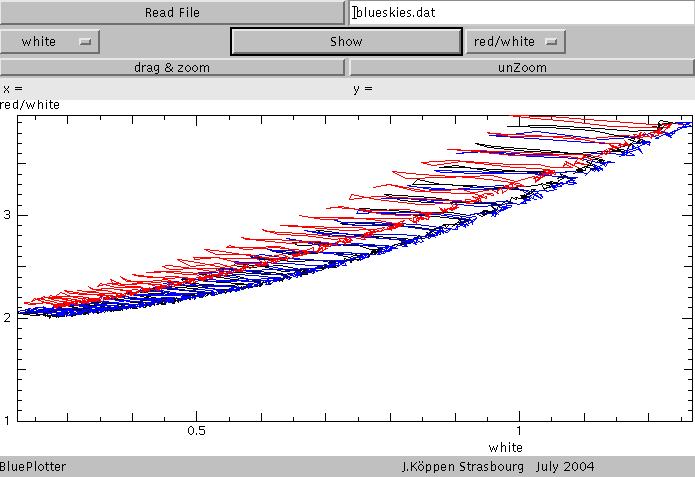
The Applet below is a test version to display the data obtained during the flight. At present, the file blueskies.dat contains simulated data, taking into account that the payload rotates during flight and thus each sensor array points towards the sun, that the brightness and the colour changes with flight time, that the sensors are slightly different, and that there is noise on the data. This is done in a reasonable way but without attempting to accurately model the sensors' behaviour!
Some explanations:

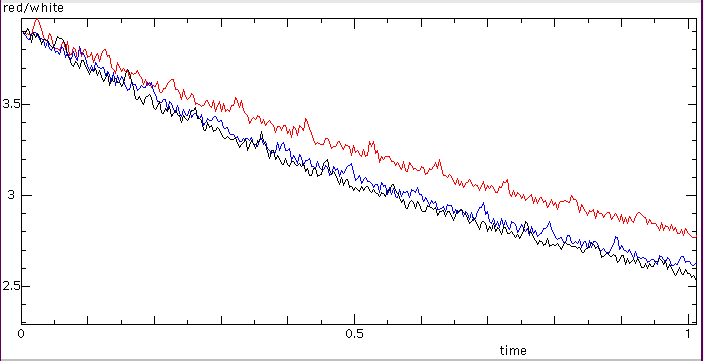
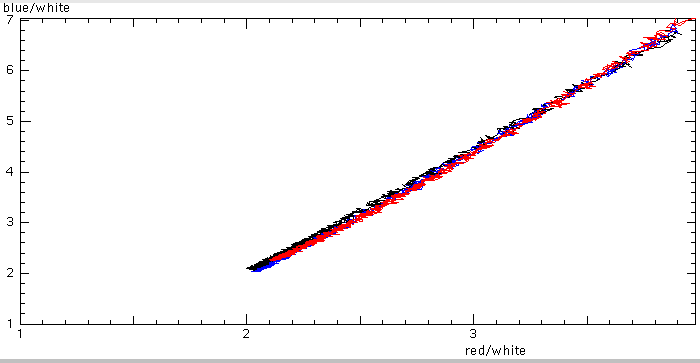
The abscissa and ordinate can be selected among Time, resistance of each channel e.g.white, or the colour for instance red/white. Show will then display the plot. Click on the plot screen will display the x and y coordinates. Click drag & zoom, then drag the cursor across the area to be zoomed. Unzoom restores the full view. The data from sensors 1, 2, and 3 are shown in red, blue, and black. To read a file, give either the name or full URL of the file, and click on Read File.
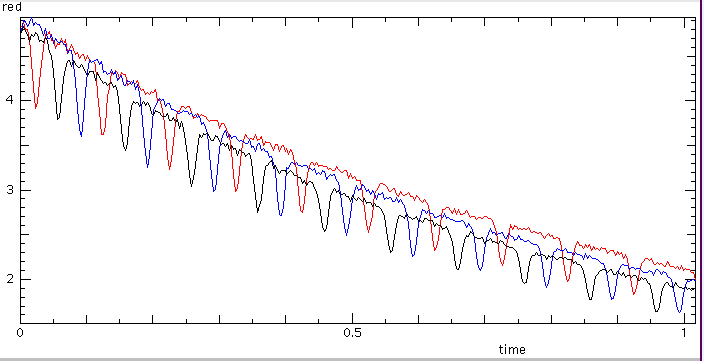
The time-resistance plot shows the drop of resistances when the sensors look towards the sun:


| Top of the Page | back to Main Page | back to my Home Page |