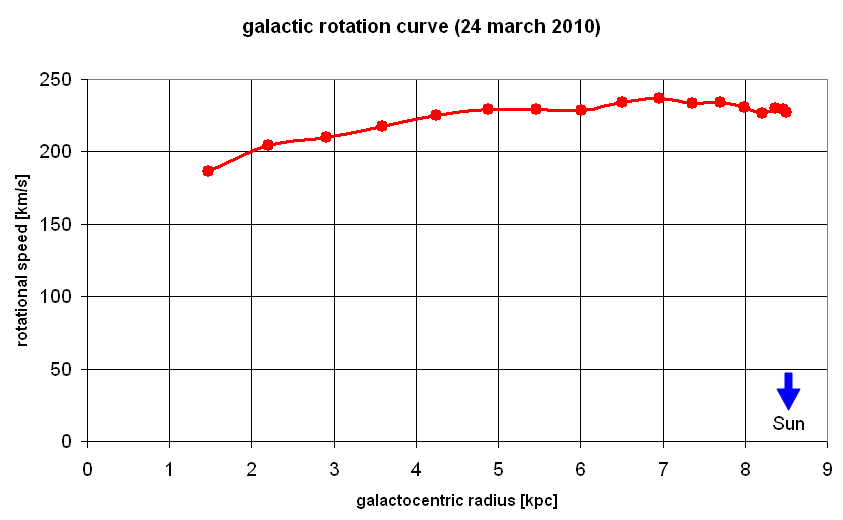
Rotation Curve of our Milky Way Galaxy
Joachim Köppen, Strasbourg, 2011/12
To startup the ESA-Haystack telescope, follow the
procedures
- Click Record to start recording the data
- The positions in the Galactic Plane to observe are:
G10, G20, … , and G90. The position of the galactic centre
(SgrA) does not give information for the rotation curve.
- Use a frequency span of 1.5 or 2 MHz, and set the centre
frequency so that you get the entire Galactic feature
- Observe each position for 5 min
Interpretation (more details):
- Import the text file with the data into Excel
- For each position (Galactic longitude l) do the following
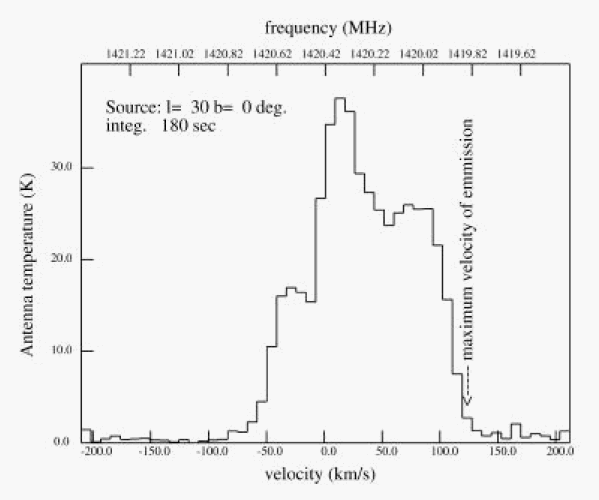
- get the average from all the spectra taken here, and plot
it in a Scatter Plot
- Determine the lowest frequency which shows Galactic emission
- Convert this frequency to radial speed, by
vrad_max = -(fmin/1420.406 – 1)*299792.458 – VLSR
where VLSR is the value of the 6th column, the correction to
the Local Standard of Rest for the direction we had observed

- Oort’s formula then gives the rotational velocity
vrot(R) = vrad_max + vsun*sin l for radius R = Rsun * sin l
with vsun = 210 km/s and Rsun = 8.5 kpc

| back to Main page
| ESA-Haystack Radio Telescope (1.4 GHz)
| ESA-Dresden Ratio Telescope (10GHz)
| to my HomePage
|
last update: Sept. 2011 J.Köppen

