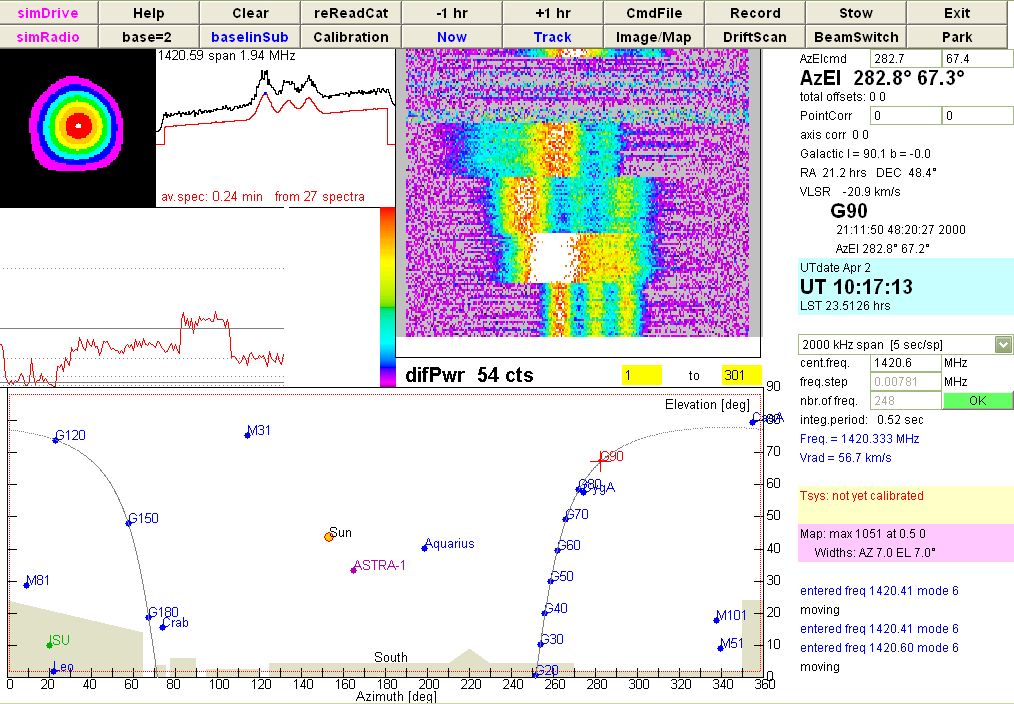
 Here are a few basic explanations. They had been written as a very
elementary introduction to the Trainer Applet, but as we shall not use
the ESA-Haystack telescope with all its options, they
may suffice instead of a complete and probably more confusing description
with all the features and possibilities ...:
Also, the Help button of the software gives access to detailed
explanations.
The following steps guide you to some basic operations:
- the main window is dominated by a display of the sky,
as seen at the current time, looking in south direction
(azmimuth = 180°). The blue dots mark a number of astronomical
sources, for instance G30 is the position in the Galactic
Plane at Galactic Longitude of 30°. The shaded areas indicate
foreground objects, such as the ISU library and trees on the
southern horizon.
- with the buttons +1 hr and -1 hr you can step
forward and backward in time, Now brings you back
to the current time.
- step forward or backward in time, until you see the Galactic
Plane between the Galactic Centre (SgrA = Sagittarius A) and
G90 and all the positions inbetween.
- click on any of those G-sources, say G40. Then the telescope
will move from its "stow" position to the requested source
position
- it takes a few seconds to reach the source - in reality it
takes a bit longer. When it is reached, the spectrum display
in the upper center will show the simulated spectrum. The
black curve is the current spectrum, the red curve is the
average over all spectra taken at that source.
- since the default spectral span of 500 kHz will show only
a portion of the simulated galactic signal, you might find
it more convenient to select with the choice at right centre
a larger span, such as 2000 kHz span, and/or to shift the
centre frequency a bit. Whatever your choice, click the green
OK button to make the selection.
- larger frequency spans take more time - the default span of
500 kHz takes one second per spectrum, 2000 kHz takes four
seconds!
- you will see the results in the spectrum display. If you click
at any position within this plot, the frequency will be displayed
in blue letters below the frequency menu on the right.
- the colour display near the upper rightish centre is a
false colour waterfall display, showing the spectra in the
form of a coloured bar, and placing one spectrum below the
previous ones. The rainbow colours give an indication of
the intensity at each frequency. When you have a spectral
feature - like from one of the positions between SgrA and G90 -
this feature will show up as in a 'brighter' colour, and
as one stays at the same position, this will form a vertical
band of that colour. In the simulated data generated in the
trainer applet, nothing else will happen; however, in reality,
this display is very important for identification of any
interference: any momentary interference or fluctuation of the
system sensitivity shows up as a horizontal
band with changed colours, any narrow band interference might
show up as a 'bright' signal at some frequency for some time ...
- other sources whose signal is simulated are: the Sun, Moon, CasA,
M31, CygA ... but all except the Sun are very weak, as in reality!
- to record measurements, click on Record button to start
the recording. Recording ist stopped by another click on Record.
The file is labeled with the date and time of the start of recording,
e.g. 1005301300.txt is from May 30th, 2010, and started at 1300 UT.
You find the file in the folder c:/SRTcassi/
- the Help button opens a window with more explanations.
- there are options by the other buttons as well as more
details which I did not cover in this brief "tutorial"
- WARNING: it might be that some details in the explanations
are still missing or need to be updated ;-)
| Top of the Page
| Back to the MainPage
| to my HomePage
|
last update: June 2010 J.Köppen

