The intensity of the emission depends on the number of hydrogen atoms encountered along the line of sight:
Hydrogen is the most abundant element in the universe, and the clouds of interstellar gas from which stars are born, consist essentially of hydrogen atoms, because of their rather low temperatures of less than 100 K. About 10 percent in mass of our own Galaxy is in the form of interstellar gas, most of which is located in a thin disk, which rotates around the Galactic Centre, along with the stars.
Since the presence of a spectral line, whose true frequency is known, permits to measure the movements of the gas clouds via the Doppler effect, the 21 cm line has been of immense value to study the motions of gas in our own galaxy as well as in other galaxies. These investigations started in the 1950s and lead to the discovery that the Milky Way is indeed a spiral galaxy. The spiral arms can be detected and the Galactic rotation can be measured with radio telescopes as small as the ESA-Haystack instrument.
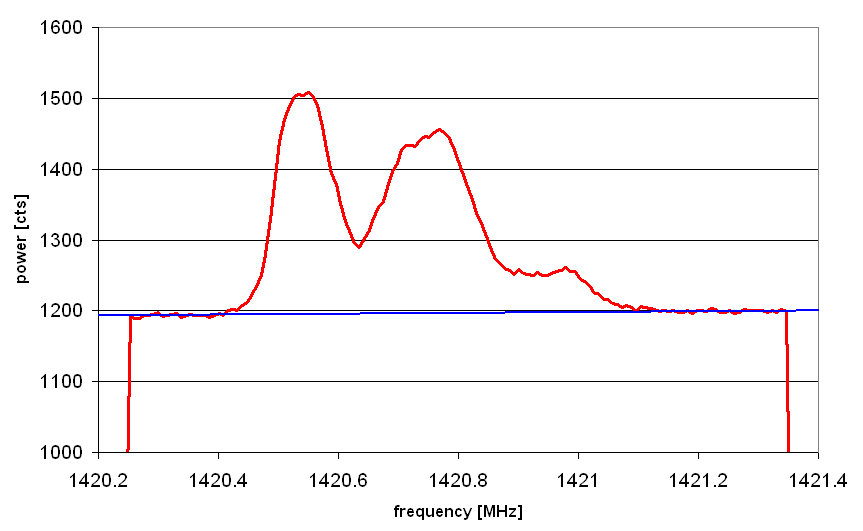
If one points the telescope towards a position in the Galactic Plane, one may obtain a raw spectrum like this:

- the cloud moves with some systemic velocity with respect to us. This movement is mostly due to the general rotation (of about 220 km/s) of the disk of interstellar gas around the Galactic Centre, but also each cloud could deviate from this general flow, just as the individual motion of people in a crowd streaming to a movie or a concert may differ from the average speed. The variation in speed of individual clouds may be of the order of 10 km/s, and it may occur that clouds collide.
- On a smaller scale, the gas parcels within a cloud may differ in their
motions, a few km/s may be involved. And finally, the gas atoms
themselves are in thermal motions, with a speed corresponding to the
temperature of the gas. For a temperature of 100K hydrogen atoms move
with a typical speed of 1 km/s. These motions are randomly oriented and
follow a Maxwellian distribution of the speed. This implies that the resulting
profile of the emission line has a Gaussian shape with the width in
frequency
sigma = average_speed/speed_of_light * line_frequency Hence 1 km/s gives a width of about 5 kHz for the 21 cm line.
We notice that the important information is in the spectral feature, and not in the height of the background. For any analysis, we shall substract this background. We may do so, because the signal here is mostly the noise produced in the receiver itself. There can be external noise from electronic pollution by all sorts of electronic and electric apparatus from the neighbourhood, also some continuum emission from the galaxy and the earth atmosphere. In the spectrum above, the background increases slightly with frequency. Thus, it is reasonable to assume that it increases linearly with frequency, and to define a straight line, the baseline (the straight blue line in the plot above), and consider for analysis the observed flux minus this baseline. If one had more information of the spectrum far away from the feature, one could even correct for a nonlinear background.
When the data have been subtracted by the background, one integrates the excess emission by the feature over all frequencies, and gets the total flux of the spectral feature ... which can be modeled or compared with models for the total emission.
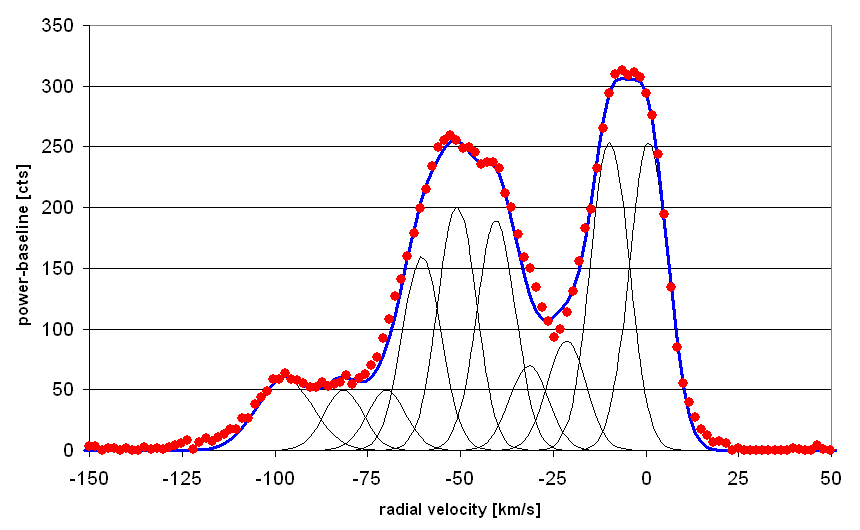
We can try to interpret the observed profile in a more detailed way. We assume that the emission comes from a number of components, each being described by a gaussian emission profile from a large number of clouds; each component may have a different average radial velocity (i.e. frequency), a different height (because of the number of clouds making the component), and a different width (because of the variation of speeds of individual clouds). If one plays with these parameters for a sufficient number of components, one may try to match the observed profile of the feature. Here is an example of a quick manual fit involving 10 components:

The feature close to 0 km/s has rather steep sides. Therefore one needs two narrow components instead of a single broader one. This gives a upper limit to the widths of the components: we had to use 35 kHz which corresponds to 7.3 km/s. This gives us the dispersion for the speeds of individual clouds. And it implies that the 0 km/s feature is probably really two overlapping features, while the broad feature near -50 km/s may be the superposition of three components.
This shows that with a more careful analysis, quite a few things can be extracted from the data. Obviously, one has to be aware that such a fitting method may have its limits and problems, such as the uniqueness of the solutions ...
| Top of the Page | Back to the MainPage | to my HomePage |
last update: Feb. 2010 J.Köppen