How to photograph the spectra
Joachim Köppen Kiel/Strasbourg/Illkirch Spring 2007
Photographing a spectrum needs to solve these questions: the exposure time can be relatively easily determined by several test exposures of different duration. When using (colour) negative film, the automatic exposure control to make the prints will compensate for any reasonable deviation from the optimum exposure. With digital cameras and webcams, experimentation of the exposure time is even easier, as one sees immediately the result.
Another question is the colour representation: In photographic
film, the colours are separated by filter layers into the different
colour extractions of the image. Since these pigments are chosen to
approximate the colour sensitivity of the eye under normal light conditions,
we cannot expect that the impression from the prints is really faithful.
For instance, the transitions between colours become much less smooth than
when perceived with the eye. However, photographic film has an enormous
advantage: it is more sensitive in the violet than our eyes. Normal colour
negative film is capable to recording well into the near ultraviolet, just
below 400 nm. Digital cameras encounter very similar effects as normal film:
Again, the light is separated by filters into red, green, and blue components,
and hence one will find evidence for the borders of these filters.
Another
effect is caused by the thin glass window which covers and protects the CCD
chip: if its surfaces are not coated with anti-reflectance coatings in a good
way, the spectrum will show broad dark bands spaced evenly in wavelength:
These are fringes caused by the interference of incoming light with light that had been reflected by the two surfaces of the window. There is nothing that can be done against it; some cameras may suffer from that, some others not. But even if one encounters fringes, they are usually broad and thus they may not prevent the detection of the narrow solar lines or degrade emission lines.
A more crucial and difficult question is that of the proper focussing. To distinguish the fine spectral lines in the solar spectrum on the focussing screen of the camera requires a fairly bright picture, and even then is not easy. Depending on the orientation of the camera and the spectral order, each wavelength region requires a slightly different focus. When we observe the spectrum with the eye, its automatic accomodation takes care of this, and we do not become conscious of this. But a camera requires setting the focus correctly. Note that your camera - a digital or one using film - should be manually focussed. No automatic focussing will be able to catch the spectrum properly ... If you have an autofocus camera, try to defeat that feature ... one student of mine, Yannick Wrtal, took about 30 pictures with his autofocus camera using different tricks, and he did get one good spectrum of the sun:
In comparison with other pictures (below) one notices the absence of the H and K lines ... evidently this digital camera was not sensitive in the ultraviolet. Only Hg at 434 nm is visible.
As a rough guideline one may take that the camera needs to be set up for the distance to the slit, as reflected by the CDROM. The focussing action by the curved data tracks modifies this setting. In my initial experiments, I roughly focussed the camera to the expected distance of about 30 cm - thus requiring an extension ring or a marco lens, and then made several shots with changing systematically the setting. Only when the prints came, it became apparent that the settings were not yet optimal ... With digital cameras this experimentation is much easier!
It is best to start experimenting with the spectra of street lamps, because their bright and sharp emission lines make it much easier to find the best focus. A nearby lamp may be bright enough for the lines to be visible on the focussing screen of a single lens reflex camera. My first attempt was a very simple arrangement:
with the street lamp towards the lower right at about 15 m from my window. The CDROM was mounted with adhesive tape inside the head of a office desk lamp which could be swiveled in any orientation. The single lens reflex camera stood on a tripod, about 15 cm from the CDROM.
The camera's lens of focal length of 35 mm was focussed (after experiments) to 2 m distance. Later trials with lenses of other focal lengths showed that they also should be focussed to 2~m distance. The lens aperture remained fully open, and I used exposure times of a few seconds. With colour negative film the exposure time is not critical, as the automatic enlarging compensates quite well any faults.
When I first saw the enlargements, I was most surprised to find two blue lines where I had seen in the viewfinder only a single violet line. Finally the measurement of the positions of the lines - which obey a linear relation with the wavelength, as can be seen in the plot to the right - showed that they are the two mercury lines at 436 and 405 nm. It is the photographic emulsion that makes them appear as blue. Moreover, my eye can only see the 436 line, and as a marvellous violet, 405 nm is already ultraviolet. Below is one of the photos, along with the identification of the wavelength scales for first, second, and third order spectra. The whitish-yellowish area near the bottom is a direct reflection from the street-lamp which I could have eliminated by placing the curtain in a better way.
This is an example of what I finally obtained from this lamp - in second order, with the Mk III model:
The blue line close to the red one is the 405 nm from third order. All lines are rather narrow, and the yellow doublet of mercury at 577 and 579 nm is well resolved! One can also get this result with light from normal fluorescent tubes.
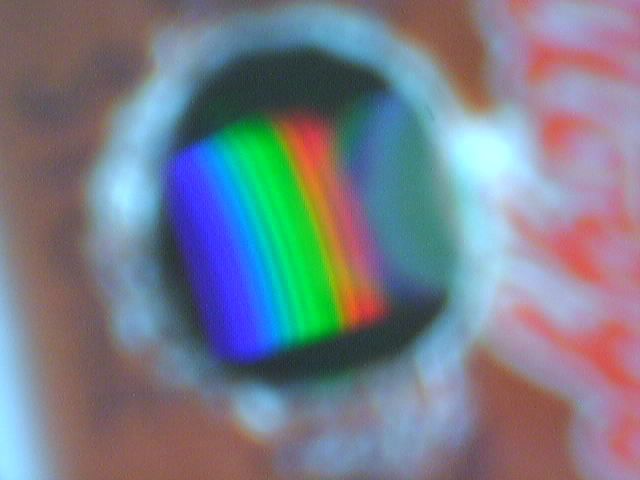
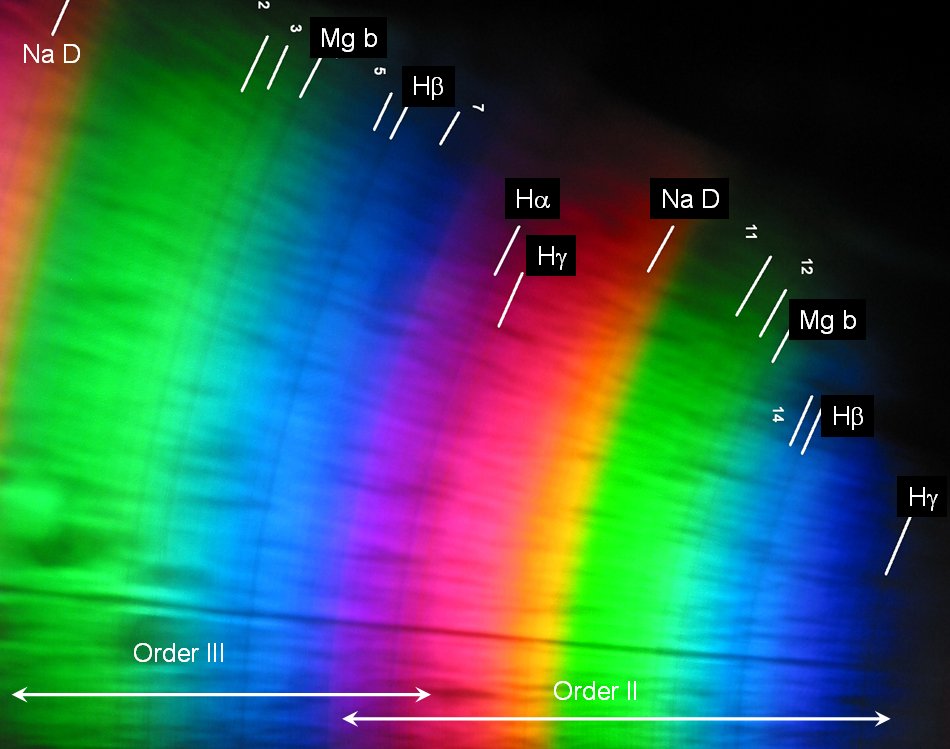
The following picture was taken with full sunlight illuminating a simple card-board slit adjusted to about 0.3 mm width. The single lens reflex camera had a 50 mm focal length lens with a 5 mm extension tube. The diaphragm was fully open - stopping it down does not give you anything in depth-of-focus, only the field-of-view becomes smaller. The camera was held directly before the observation hole, in place of the eye. Exposure time was 1/100th of a second on a normal 200 ASA colour print film. The picture is a composite of the three best selected among a number with various distance settings and orientations, as to cover the various spectral orders.
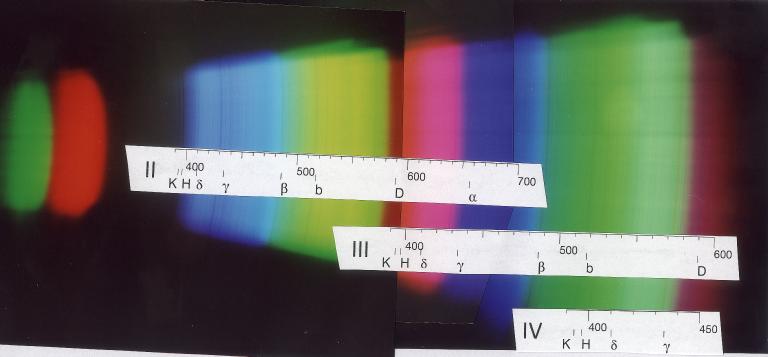
The wavelength scales were computed on the basis of a linear realationship between position on the print and wavelength, and calibrated with the second-order spectrum (II). Since the camera had been held at different angles, and because of the extremely flat angle of incidence of the light from the slit, one cannot expect this relation to be still strictly valid.
On the left, there are the green and red remnants of the first order spectrum, the clearest part is the second order one whose red part already overlaps with the blue part of the third order thereby producing the pinkish color. In the green-yellow section of the third order one finds already the lines around the hydrogen Hg line from the violet part of fourth order.
Evidently the focus was best for the blue part of the second order. The strong lines H and K of ionized calcium are seen just below 400 nm - they are not visible with the eye whose spectral sensitivity reaches only down to about 430 nm. But the photographic films records it easily - the same applies to the 405 nm line from mercury vapour street lamps. The lines of the Balmer series of hydrogen (Hd and Hg in the blue, Hb in bluegreen, and also Ha in the red) are present. In the green, the magnesium "b" line is seen.
Later, I used a 100 mm lens which I set at a distance of 1.6m (after long experimentation ...) to obtain pictures like this:
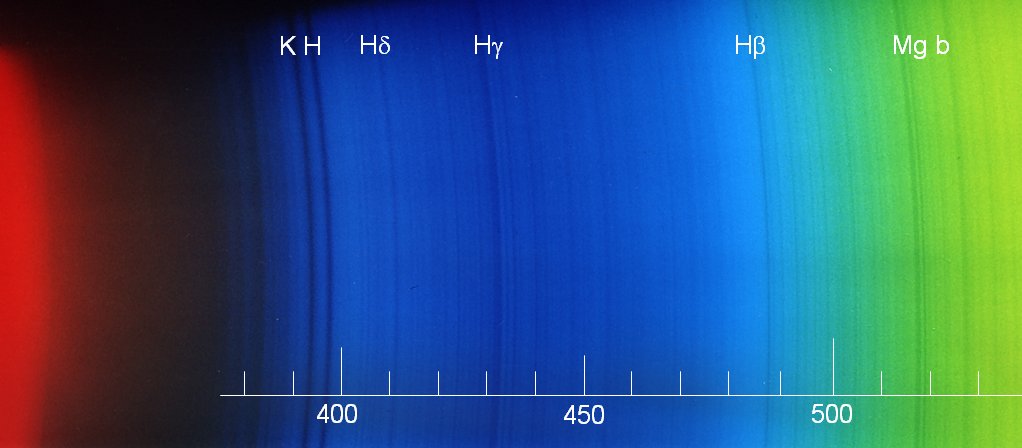
Apart from the lines indicated, one notes the iron lines at 489, 492, and 496 nm as well as at 527 and 533 nm. In the blue, 420 (iron), 423 (calcium "g"), 427 (iron), 432 (iron, just blueward of Hg), and 440 (iron) can be identified.
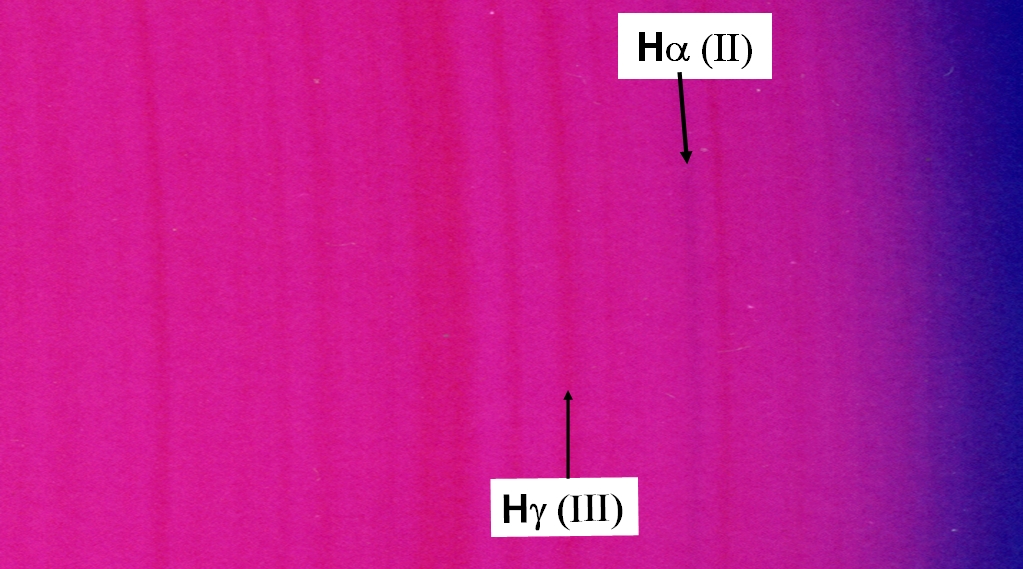
The following zoom show the overlap region of the red second order with the blue third order. One sees the lines around Hg, but also Ha as a blueish feature, since in the overlap region the blue continuum of the third order shines through.
However, I must emphasize that the direct view by the eye is still substantially better: The fine lines appear darker, almost black, and our eye's autofocus system makes all lines to appear sharp and clear. One can easily see the three magnesium "b" lines well separated already in second order; the sodium "D" line is seen as a pair, with the same separation (0.6 nm) as the blue pair of magnesium "b". This is of course even better in the third order. On the other hand, the eye's sensitivity peaks in the green, and drops off strongly in the violet and the red. Thus, the Hg line at 430 nm needs a bright source indeed, such as direct illumination by the sun. This also applies to Ha at 657 nm which one does not find too impressive, though it is the strongest optical hydrogen line.