- Basics
- Observational Procedures
- Analysis and Interpretation
- More about our results
- Lunar Challenge
- Results from 2011
The Moon is a difficult but very interesting object: It is a rather faint source,
usually 0.5 dB above the level of the empty sky, which is comparable to the normal
fluctuations of the background noise. Its emission is the thermal radiation from its
surface. Since the surface is heated by the solar radiation, the temperature depends
on the lunar phase. The fascinating thing is that the average temperature is not
highest at Full Moon, when all the surface is lit, but several days later. This
was discovered in the 1950s and indicated that the surface was not solid rock, but
covered with a layer of dust, which takes some time to heat up under sunlight. This
finding caused quite some concern for the program to land men on the Moon, as
it was not clear how thick this layer was, and whether it would be able to support
a landing vehicle ... These temperature variations are only about 10 percent, which
presents quite a challenge in view of the faint signal and the difficulties to obtain
sufficiently good quality observational material. But what would we do without
challenges?
Observational procedure
Important notes:
After starting up the system, described here,
we recommend to follow this sequence:
Analysis
Let's suppose that we use Microsoft Excel to do the interpretation of the data.
Then we recommend to follow this sequence:
To determine the temperature on the surface of the Moon, we also need to know
the fraction with which the Moon's disk fills the antenna beam:
Finally, it is worth estimating the errors on the temperature. What are the sources
of error:
Which error is the dominant one? Can we improve our technique, and where?
More about our results
Our first successful observation, after the refocussing the the telescope,
was done on 26 April 2007. We got full scans like shown below, which was taken
five days before Full Moon:
The signal is only 0.5 dB over the background level, but with some practice, one can
locate the moon ... The observations shown also display the flux calibrations on
the Holiday Inn hotel; if we assume that it has a temperature of 300 K, the antenna
temperature for the moon was 15 K; from the scan profile, one deduces an antenna HPBW
of 1.9� (which is larger than measured with the much better profile obtained with the
Sun - obviously an effect of the greater imporatnce of noise), and it gives a temperature
averaged over the lunar surface of 211 K! A second scan taken one hour later gave the
same numbers. The small wiggle just before 18:45 was the manual search about the
expected position for the lunar signal. Once found, we placed the telescope a bit to
the west and a bit higher, and waited for the moon to pass through the beam ... and
sometimes it does so!
However, the Moon is a very difficult customer, as Zahrah Musa found out during many
nights in 2008: Not only rain clouds make it impossible to pick up the weak lunar
signal, and the thermal emission from the clouds themselves can be stronger than that
of the moon. Also the slightest veil of clouds can upset the signal by its emission.
So when you try to locate the Moon, and find some enhancement of the signal, you
may also find that this signal fades away as slowly as the Moon would do it ... since
clouds also move across the sky ... but then the signal may go up again ... eventually
you get really confused and frustrated.
The plot below (from Marina Lemberg's data) shows the signals during a day when sun,
rain, and winds came and went in succession: The high signal at lunchtime is the
transit of the Sun, but the other peaks are simply rain clouds passing over:
It is clear that against these clouds, the Moon - at about +42.5 dB�V on that day -
would have little chance to be observable!
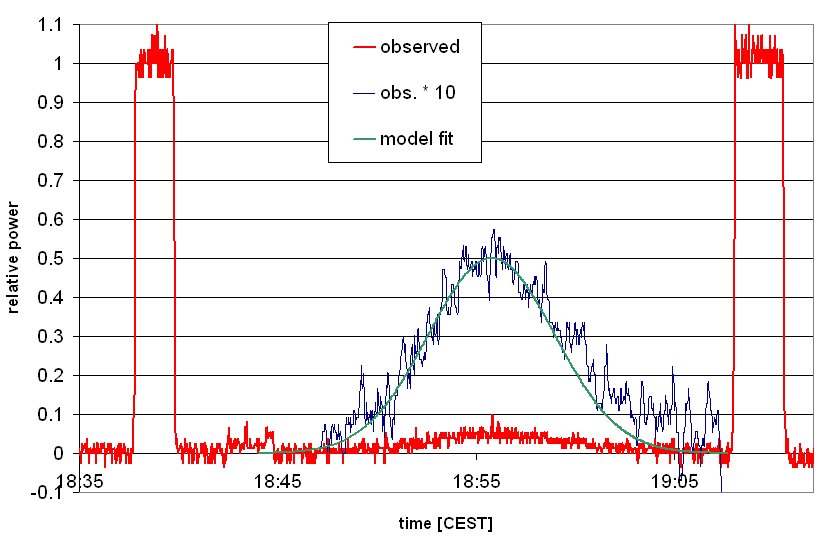
On the next day - sunny and blue skies - Marina had the chance observation of the New
Moon following the Sun in its lunchtime transit:
The dark blue curve is the lunar signal multiplied by ten, for better visibility. The green
curve is a smothed version of the blue curve. Both show that the Moon has an antenna
temperature of about 20 K, which is - within the error bars - the same as we had observed
at full moon. To further improve our techniques of observation and analysis were our
next steps ...
We thus learned that a major limitation is not due to our instrument ... it is the
natural weather which we can do nothing about! The Moon remains a nice and challenging
target, but you need a cloudless sky for that! .....
... but it ain't necessarily so!!!!! The following observations were done when the
Full Moon was behind a layer of fog. It was still fairly easy to distinguish the dark
mare and bright highlands on its face, but I would not have bothered to bring out
an optical telescope to view the Moon. However, the radio data are as good as those
taken during a cloudless evening a few days earlier!
More details of our results and techniques may be found here:
The Lunar Challenge
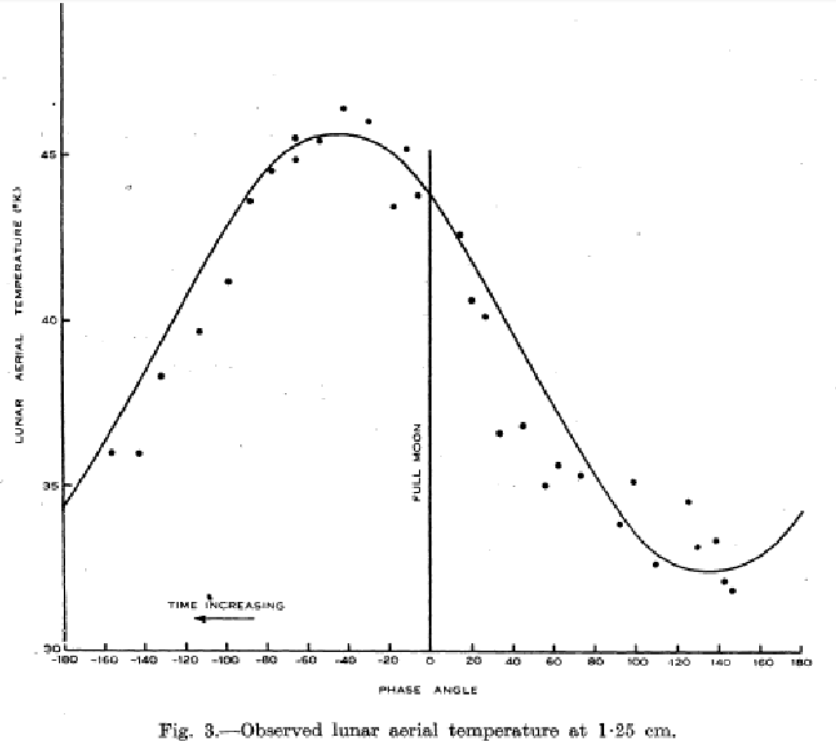
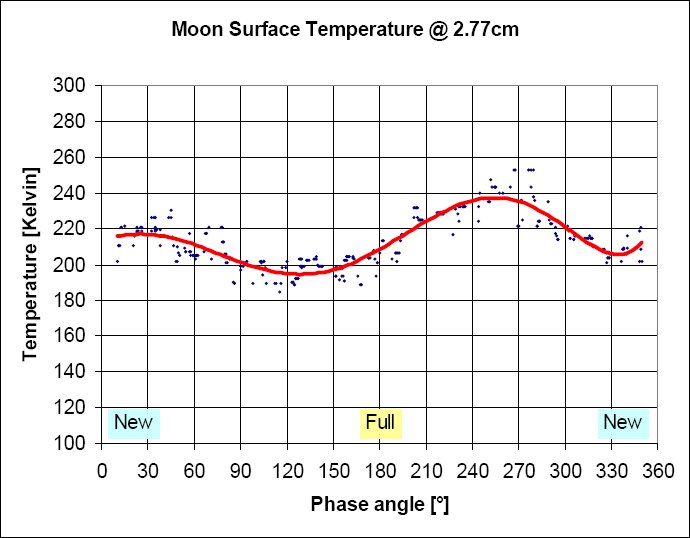
How does the lunar surface temperature vary with lunar phase?
The lunar surface is heated by the solar radiation and emits thermal radiation
in the infrared and radio range. Already in 1949, J.H.Piddington and H.C.Minnitt
(Australian Journal of Scientific Resaerch A, vol.2, p.63) showed
that the radio flux from the Moon varies with the lunar phase. The temperature,
averaged over the lunar face, is highest not at Full Moon, as one might have guessed,
but about 4 or 5 days later. They fit the results with
This time delay revealed (long before the human lunar
landings) that the surface of the Moon is composed not of solid rock, but that it
is made from broken-up material, such as dust and small pebbles. Because of the
smaller thermal contact between the solid particles the layers below the immediate
surface heat up only slowly. This temperature variation has been shown to be
detectable by conventional satellite TV receiver equipment
(C.Monstein, 2001
or here).
... so, can ESA-Dresden do it?
Results from 2011
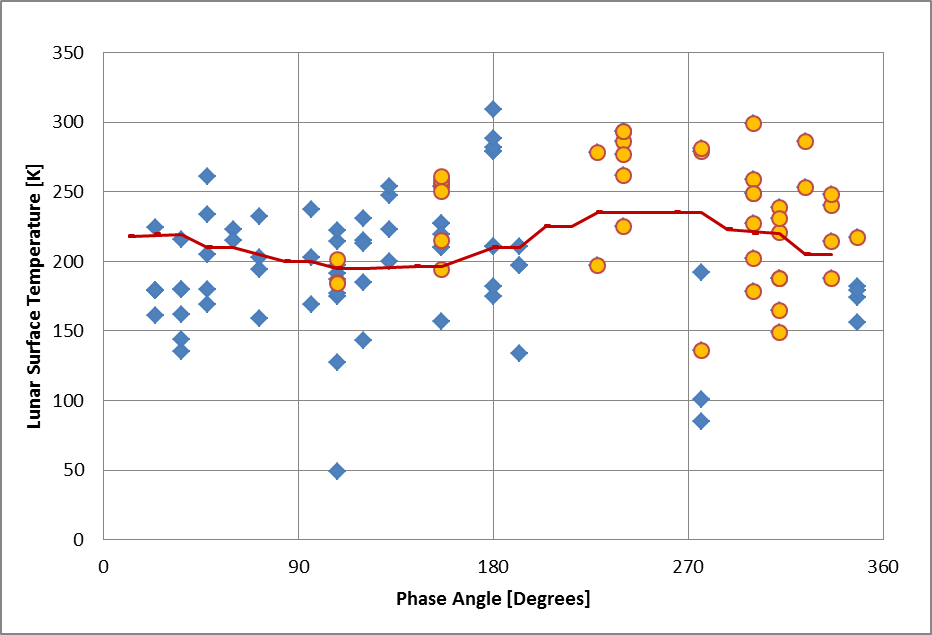
Employing this improved technique possible with the new software, Mary-Anne Fobert
was able to take 106 individual measurements of the Moon, covering the entire lunar
phase range. To our great surprise, meaningful measurements were obtained during
nearly all weather conditions that were present this winter: clear sky, mist, fog,
and overcast sky. Only during a snowfall the lunar signal could not be pickd up.
A comparison of her data with Monstein's curve (in red) is shown below:
The average values correspond well with these other observations, however the scatter
is still too large to detect the systematic relation with lunar phase.
Some data - like the one with a very low value of 50 K - obviously come from
observations where the Moon did not pass through the center of the antenna lobe.
A careful look reveals that the readings taken when the Moon was observed at elevations less than
20 degrees (orange dots) are systematically higher than the ones taken at higher elevations
(blue diamonds). The reason is quite simple: at lower elevation we observe through a larger
airmass and hence we receive a larger amount of thermal radiation from the atmosphere than
if the Moon is observed closer to the zenith (see also here). Since
in our analysis we do not yet separate the elevation-dependent atmospheric noise
from the constant receiver noise, as it would require numerous additional measurements,
we overestimate the lunar temperatures!
An even closer look shows that the weather does not affect the measurements
Blue diamonds indicate clear skies, green squares overcast skies, fog, or mist, but all
taken at elevations higher than 20 degrees. Yellow symbols refer to observations at low
elevation, the circles showing clear sky conditions. It is clearly the elevation effect
that dominates!
Lastly, we had become aware that our previous elevation for the flux calibration was
not sufficiently low enough for the Holiday Inn building to fill the antenna beam
completely. Hence, we now use point 2 degrees lower. As a consequence, the system
temperatures (and hence the derived lunar temperature) now are significantly lower,
as shown below:
Yellow dots are measurements done with the old calibrator position, red dots
with our new position. It demonstrates how our system temperature increases
due to the higher sky noise at low elevations, but that the measurements with the
old calibrator give values systematically higher by about 50K.
Having identified these two effects, we now can refine our observational techniques!
Next round ...
A more reliable method of flux calibration is described here,
and how to interpret the measurements.
.
| Top of the Page
| Back to the MainPage
| to my HomePage
|
last update: oct 2020 J.Köppen