The interstellar hydrogen gas of the galactic disk moves in nearly circular orbits
around the Galactic Centre. As one finds from the rotation curve
the orbital speed is almost independent of the distance from the Centre. If we assume
that the speed is constant (or if we use the rotation curve), we can compute for
every position of the disk the radial velocity under which this parcel of gas would
be observable from our position. Note that the frequency of the line emission
is shifted via the Doppler effect only by the radial velocity.
For a parcel of gas
at a distance R from the Centre and at galactic longitude l one gets
with the parcel's rotational speed vrot(R) and the solar distance from
the Centre Rsun = 8.5 kpc and its orbital speed
vsun = 230 km/s.
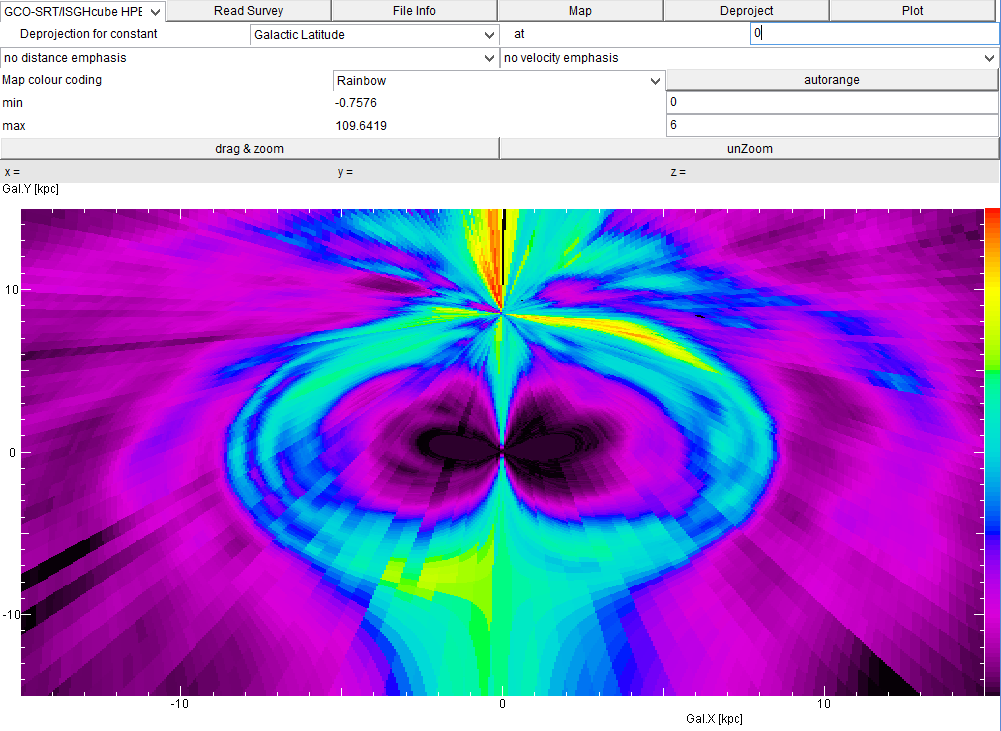
In this manner, we can assign to every position (characterized by galactic longitude l
and distance R from the Centre) in the Galactic Plane the observable
radial velocity. In the survey data we then look up the intensity of the emission
at that radial velocity, and indicate this value (by the colour in the map) on a
map of the Galactic Plane, we can get this image of the Galactic Plane:
The Galactic Centre is in the middle (x=y=0), the Sun at top centre (x=0, y=8.5 kpc).
There are two artefacts in such a map, because the Doppler effect can only tell us
about the radial velocity:
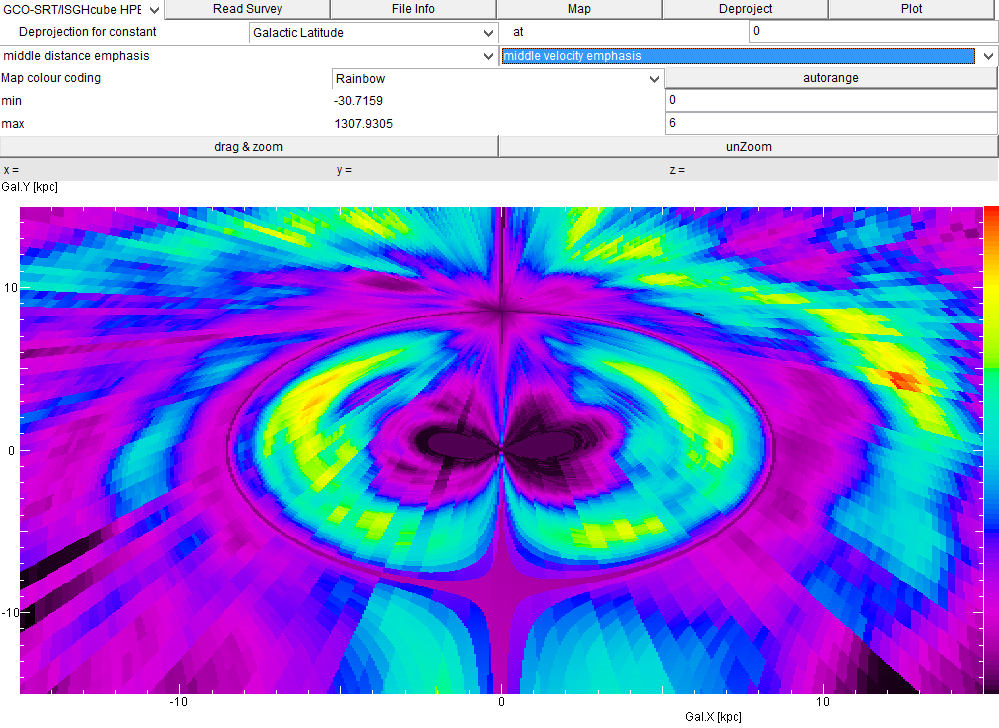
To suppress in the maps these regions of confusion, you have two controls: with distance emphasis
emission from larger distances is more strongly weighted, and with velocity emphasis
the intensities are weighted with the velocity. In the example below, application of the
velocity emphasis makes the zero velocity areas less prominent:
Both controls are merely to enhance the view, and permit to bring out better the
spiral arms (inside and outside the solar orbit).
The example above was done for the Galactic Plane (i.e. latitude 0ş), but one can
create these maps for any other galactic latitude.
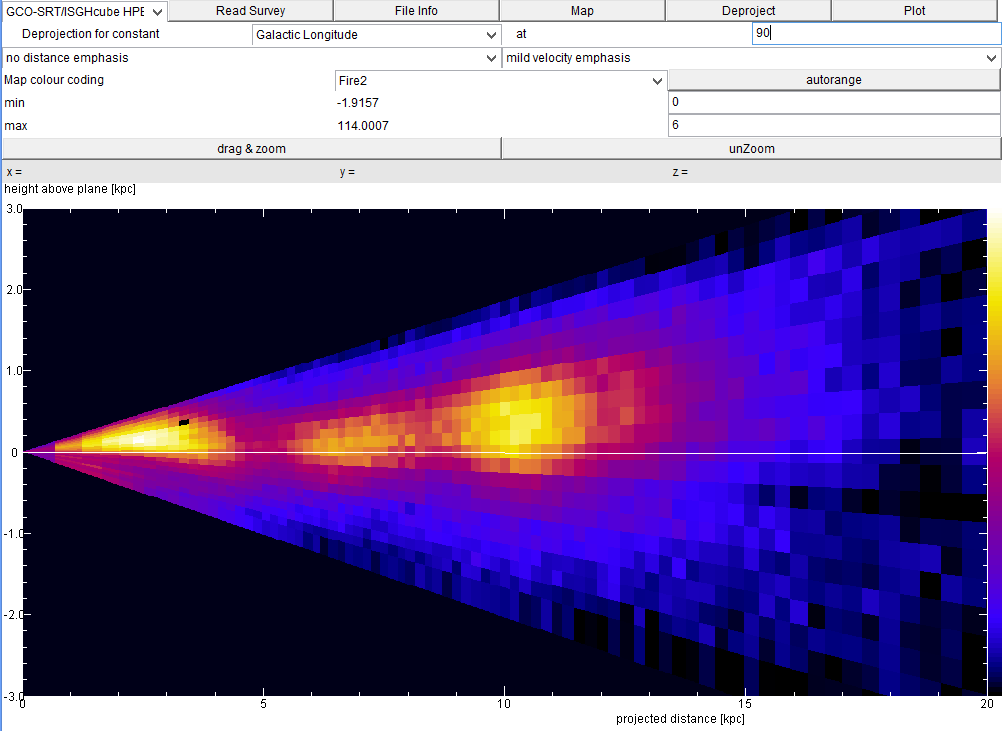
To get a view of the distribution of gas above and below the Galactic Plane, you can
chose to display the deprojection map for a constant Galactic Longitude, for
instance at galactic longitude l=90ş:
These are the same data as seen in the velocity-latitude map.
| Top of the Page
| Back to the MainPage
| to my HomePage
|
last update: March 2014 J.Köppen DF3GJ
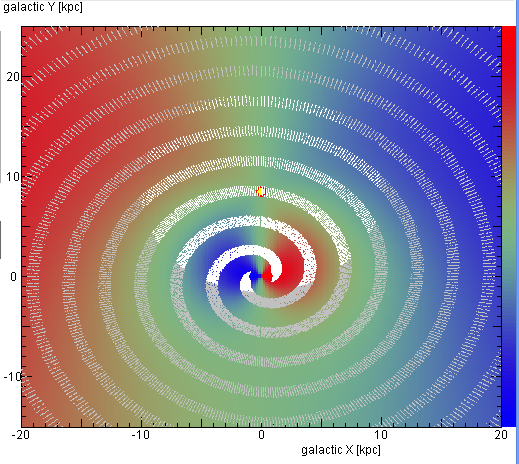
These areas of confusion are also shown in a model for the galactic disk. The red
regions indicate where gas would appear to be red-shifted (to lower frequencies) i.e.
moving away from us, blue regions where gas would be bluehifted or seen approaching
us. In the grey-greenish area the radial velocity would be close to zero.
The sun is marked by a yellow dot, and the white spiral arms are a simple model.
Thus, when we look towards l=90ş (viz. to the right) we can pick up emission from
gas that appears to come towards us; and we would pick up local emission (at zero
speed) and two or three spiral arms with negative radial velocity.