KURT = Kiel's Universal Radio Telescope
Joachim Köppen Kiel Dec.2023
Some brief explanations
This is a simulator of a radio telescope which can work as a single full paraboloid
dish or as an interferometer composed of a number of dishes arranged in East-West direction.
It can work on any frequency between 100 MHz and 350 GHz.
The antenna diameter can be chosen to be any value, but it needs to be larger than 10 wavelengths
to behave in a physically correct way.
It should also be not much larger than about 1000 wavelength, as then main beam would
be narrower than the precision of the position system of 0.01°. As an interferometer,
it is supposed to be a local instrument with maximum baselines of a few 100 wavelengths,
as the curvature and the size of the Earth are not taken into account.
The characteristics of its receiving system and its positioning system represent the
current technology which is freely available rather than involving entail a special
and costly development effort. It does not try to model the present limits in
sensitivity or resolution of major professional instruments, but it could be found
with an amateur installation and thus would be quite imaginable for any small or medium-sized
astronomy institute. But as the antenna(s) may be given properties that are
mechanically not realisable, one can do things that are impossible to do in reality.
The simulated sky is populated with a realistic but quiet Sun (no solar activity!),
a realistic Moon, several major radio sources, a few imagined sources, and a background
radiation from the Milky Way and the remnant of the Big Bang.
The influence of the Earth atmosphere is modeled by its frequency-dependent absorption
and thermal emission, as well as some variability due to local weather. Variations
of the noise from the receiving system and from terrestial events may occur in a
realistic way, as had been experienced using real instruments at various frequencies.
When not running and operating, the 'instrument' may be used to inspect the sky
at different times, and to see the received level from sources, e.g. in preparation
for planned measurements.
For further explanations look at the pages Single Dish and Interferometer which describe these operational modes in more detail and show result examples.
Access to the simulator is organized in three pages: Operate, Skyview, and Output. Here is a description of the controls:
Operate: this is the main page, from which all operations are effected, and where all information are displayed.
Before we start observing, we need to select the telescope type and specify some technical data:The type of the instrument can be:
- Single dish: an antenna with a paraboloidal reflector. Give the frequency and the diameter of the reflector.
- E-W adding interferometer with 2 antennas: Give the frequency and the diameter of the single dish, and the separation between the antennas.
- 2-element E-W correlating interferometer:
Give the frequency and the diameter of the dishes, and
the separation between the antennas.
There are two options:
== correlator cosine output shows the fringes from the real part of the complex visibility.
== visibility as a function of time, e.g. during a drift scan.
Also, the current visibility amplitude is plotted in a second graph. Measurements taken at various baselines can be collected. Later, the resulting visibility curve can be displayed and outputted as a table. The maximum baseline for the plot may be entered. - E-W interferometer with N-baselines: This correlating instrument consists of the specified number (a power of 2) of antennas which are placed along an E-W line in such a way that the separations between the antennas cover the interval between 0 and the specified maximum separation evenly. Give the frequency and the diameter of the individual dishes.
- Startup: click this to start the operations. If everything
starts up properly, the clock will show the current time in UT,
and the local sidereal time LST. Also, now all controls can be
operated.
A second click will stop the operations -- however, this would make real sense only with the real instrument, of course. - goto Calibrator: clicking this lets the antenna go to the flux calibrator, which is a nearby large building which provides thermal radiation at ambient temperature, like the ground. Thus we look at a source of well-known temperature - about 290 K.
- goto Park: this lets the antenna go to its parking position.
- Sun now: a click will display the current position of the Sun in the sky in the fields to the left of the Goto button. Note that this will not move the antenna. If the Sun is below the horizon, the text fields will show a yellow background.
- Moon now: displays the current position of the Moon. Again, this does not move the antenna.
- Sun ...: from this list of sky objects one may choose an object, whose present position in the sky is displayed.
- now: one may choose to pick the object's position at the current moment ("now") or at some later time (e.g. " in 10 min").
- Go & Track: clicking this commands the antenna to go to the
position displayed (left of Goto button), and to track it on its way
across the sky. When tracking, this button's text is blue.
Clicking on it again stops the tracking, and the antenna halts at the last position. - current Position: displays the sky position (azimuth, elevation) where the antenna is now pointing at.
- AzEl: (this button will eventually have additional features ...)
The two text fields to its right side are used to display the present position of the sky object selected as above, but the user can also enter the position (azimuth, elevation) to which the antenna should go. - Goto: clicking this button lets the antenna move to the position given in the text fields to the left.
- Offs Hor. Vert.: the user may enter any offsets to the current
position. Enter your values and hit the 'Enter' key of your keyboard.
Note that the offsets are in real angles, so that the horizontal offset is Δh = Δa * cos(e) differs from the offset in azimuth! - Record: click on this button starts recording all measurements as text on the Output page. Another click will stop recording. Recording data is only possible when the program works in the current time (Now). Note that the Output page starts afresh when the next recording is started.
- Single measurement: executes a single measurement.
- Subtract background: in the N-baseline interferometers one may subtract the sky background, which is useful in particular for weak sources.
- the Plot: usually shows the received power in terms of decibels (dB)
relative to the level of the receiver noise or as a function
of time.
Passing the mouse over the plot area will display the time and power at the mouse position.
The curve is grey when one is not recording, but red when data are recorded - Visibility Plot: when recording in interferometer mode, a second plot
is shown for the visibility amplitude as a function of the projected baseline.
Passing the mouse over the plot area will display the relevant data at the mouse position.
The Reset button permits to clear the plot and reset the table of collected visibilities.
The log Visi button displays the visibilities in logarithmic or linear fashion. - Ymax, Ymin: enter the desired value(s) and hit the 'Enter' key. The plot is refreshed to show it with the new plot limits.
- Xspan: choose the desired time span to be shown. The plot will always start with the time when the simulator was started or - when small time spans are chosen - at an even number of span intervals later. The simulator has a memory for about one hour.
- Set: applies the above changes in the plot limits to the plot.
Skyview: shows the situation in the sky above the antenna. The grey
area near the horizon shows the ground, two antenna masts, and the small
grove of trees in the south-west which serves as the flux calibrator.
Sun and Moon are indicated as yellow and cyan disks, other celestial sources
are shown as red dots with their name. The blue curve across the sky is the
mid-plane of the Milky Way, with galactic longitudes of 90 and 180°
marked as blue circles, and the Galactic centre as a blue dot. A dotted
grey curve marks the celestial equator.
When the simulator has been started up, this plot is updated in real time.
- Now: click this to show current situation.
- time - 1 hr: click this to show the situation one hour earlier ...
- time + 1 hr: ... or later
- Position: a mouse click on the plot then shows the position (azimuth, elevation)
Output: when data are recorded, they are displayed on this page. From here they may be copied and pasted into a text file for further interpretation. First comes a header of comment lines (starting with *) which provide all the technical information of the instrument with which the data are taken. The format of the measurement data is described in a comment line, after which the data lines follow.
| Top of the Page | JavaScript Index | Astropraktikum: Radioastronomie | my HomePage |
Single dish operations
How to ...
- ... make a drift scan of a source: This is to point the antenna at a position where the source will be some time later. One waits for the body to pass through the centre of the antenna beam, thereby allowing to measure the peak power (i.e. the power from the source's radio emission). Is the antenna beams wider than the object's diameter this curve shows the shape of the antenna pattern and measures the angular resolution of the antenna (or HPBW = Half Power Beam Width) which is an important value for the interpretation of the measured data.
- choose e.g. "Sun" as object
- choose for example "in 10 min" as the wait time
- click "Goto"
- record the data
- wait for the Sun's passage ...
- ... make a map of a source: While one could compose a map from measuring the source power at many positions offset from the source - which needs to be tracked - it is much easier to perform drift scans across the face of the source, but with different offsets in elevations, and then stitch together the results.
- choose e.g. "Sun" as object
- choose for example "in 10 min" as the wait time
- click "Goto"
- record the data
- wait for the Sun's passage ... until we get down to the sky background
- choose again the same wait time
- choose a vertical offset, and hit the 'enter' key
- ... and so on ...
- ... monitor the solar radiation: This would be needed when you are interested to search for solar radio bursts due to activity. One simply tracks the Sun and records the data.
- click "Sun now" or choose "Sun" as object and "now" as wait time
- click "Go & Track"
- record the data as long as you need or want. 7 hours have been done without problem.
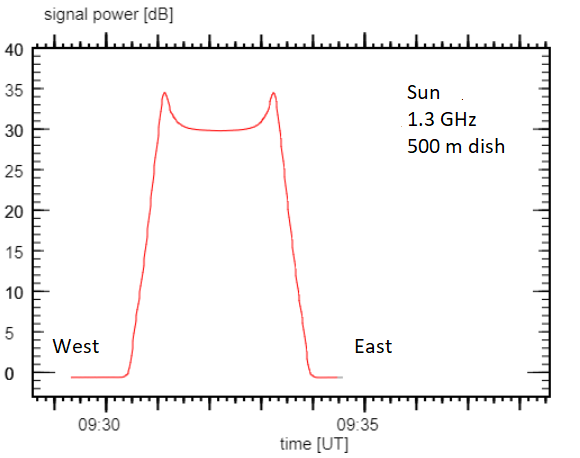
Theoretical profiles of the radio Sun for any frequency
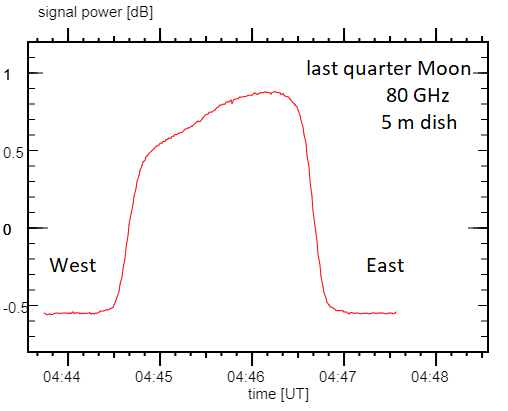
Maps of the radio Moon for any frequency and time.
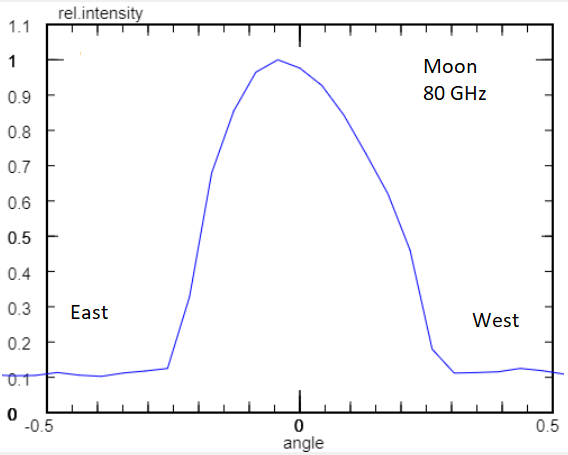
Expected drift scans of the radio Moon for any frequency and phase.
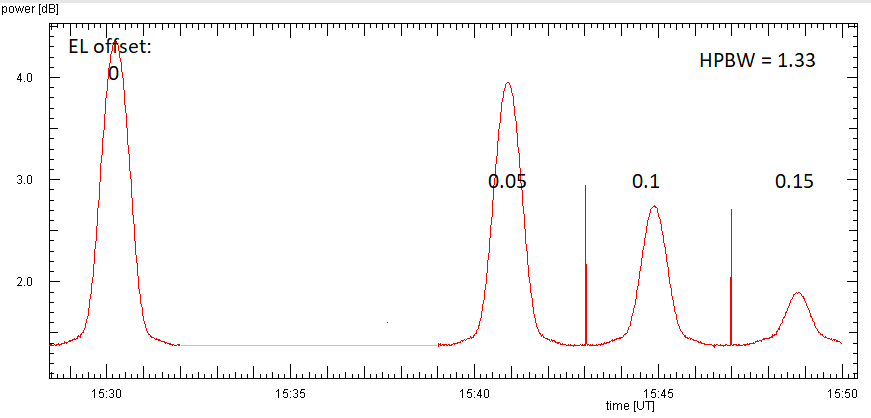
These are a couple of drift scans with offsets of a small source.
... to calibrate the measurements:
Because the noise produced by the receiving electronics and the Earth atmosphere is one important part of the received power, we need to determine the state of the instrument and of the atmosphere, if we want to interpret our data correctly. This is done by measuring the noise from the empty sky at several different elevation angles:
- go to the Calibrator to measure the radio noise produced by a house, a dense clump of trees, or the ground Tcal = 290 K) which adds to the receiver noise, represented by Tsys. The (linear!) power --- i.e. p = 10pdB/10 --- is pcal = g (Tcal + Tsys) with some instrumental factor g. Measure long enough that the random variations can be averaged sufficiently well!
- point the antenna to several elevations el and measure the noise of the
empty sky, sufficiently long, to get
psky(el) = g (Tsky(el) + TCMB + Tsys)
TCMB = 2.7 K is from the Cosmic Microwave Background radiation, which comes from all directions in the sky.
preceived = poutside atmosphere exp(-τ) with the 'optical thickness' τ(el) = τzenith/sin(el).
It is useful to call the factor A(el) = 1/sin(e) the airmass, and also convenient to express the zenith attenuation in deciBels as
azenith = -10 log10(exp(-τzenith)) = 4.343 τzenith.
At most frequencies, the Earth atmosphere does not absorb very much radio radiation, but it does contribute to the noise measured by the antenna, because it emits thermal radiation. This foreground noise is present in EVERY observation of a celestial object, and hence we need to know it well, if we want to interpret our data. The thermal emission by the atmosphere provides a noise signal of the temperature
Tsky(e) = Tsky0 (1 - exp(-τ)) where Tsky0 = 270 K is the radiation temperature of the air.
- At frequencies below about 10 GHz the absorption of the Earth atmosphere is
very low, so it can be neglected:
Tsky(e) = Tsky0 τ(el) = Tzenith/sin(el) with the zenith sky temperature Tzenith = Tsky0 τzenith.
Hence psky(el) is a linear function of the 'airmass' A = 1/sin(el). We match the data with a straight line (linear regression) p(A) = b + m*A. The offset gives b = g (TCMB + Tsys), the slope m = g Tzen, and the calibrator measurement pcal = g (Tcal + Tsys), we can determine all three unknowns: factor g, zenith and system temperature. - At higher frequencies the atmospheric absorption must fully be taken into account.
Then all the measurements need to be matched by the complete expressions for each elevation:
psky(el) = g (Tsky0 (1-exp(-τzenith/sin(el) + TCMB + Tsys)
together with the calibrator measurement pcal = g (Tcal + Tsys)
to find the best values for g, zenith attenuation, and system temperature. This is best done with an optimizing software, e.g. SkyProfileAnalysis tool
| Top of the Page | ESA-Haystack radio telescope on 1420 MHz | ESA-Dresden radio telescope (10-12 GHz) | Website of DL0SHF Radio Observatory and Ground Station | Astropraktikum: Radioastronomie | my HomePage |
Interferometer operations
- Interferometer geometry: Both antennas point to the source which lies at the
the angle θ off the direction perpendicular to the baseline b.
Thus the wavefronts from the source make an angle θ with the baseline, and
the path to the left antenna is longer by b sin(θ) than to the antenna at right.
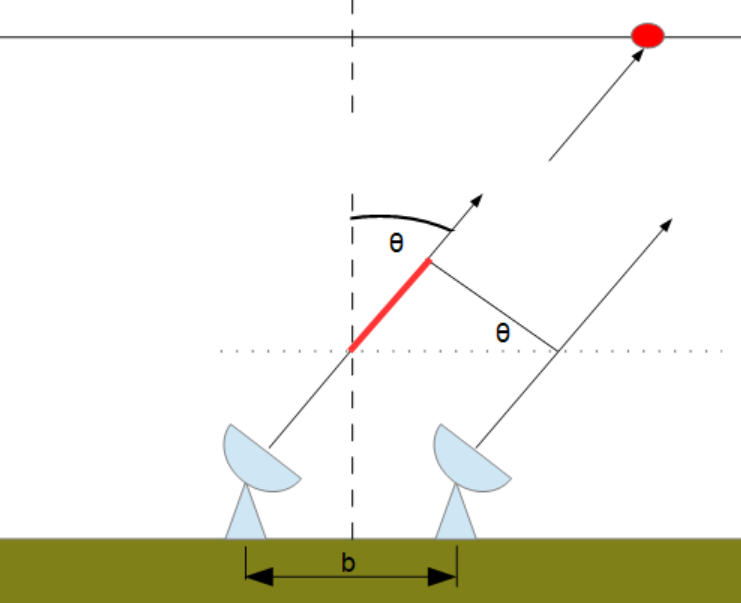
A good description of the 2-element interferometer operations may be found with A.T.Moffet (1962, Astrophys.J.Suppl. 7, 93). - Adding Interferometer: If the signal from the source reaches a single antenna
not only directly, but also via a reflective surface - such as the sea or the wet
ground - or the cables from two antennas are connected to the receiver, so that the
two signals are added together, the receiver gets a strong signal when the signals
are in phase, but no or a weak signal when they are in opposite phases. This technique
was used in the very first years between 1945 and the early 1950s.
It did take a bit of patience ...- choose "Adding Interferometer"
- use a small antenna to get a HPBW larger than the object
- Startup
- choose the object "Sun"
- click "Goto"
- record the data
- at the end, move antenna at the same elevation to the East well away from the source. Measure sky noise for a while.
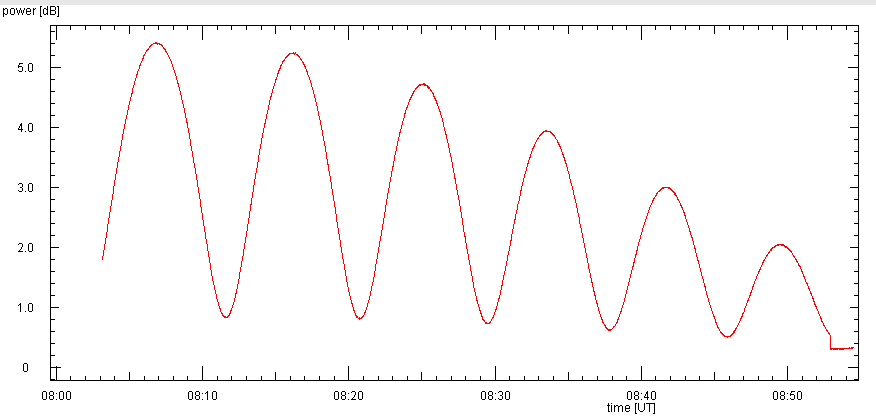
This observation of the Sun was done on 1.3 GHz. The strong interference fringes show that the source size is much smaller than the antenna's HPBW 13.4°. As the Sun moves through the antenna beam, the fringes get smaller. At the end, the antenna was moved to the East, well away from the Sun, but at the same elevation as before, in order to measure the noise level of empty sky, which constitutes the zero level for the signals.
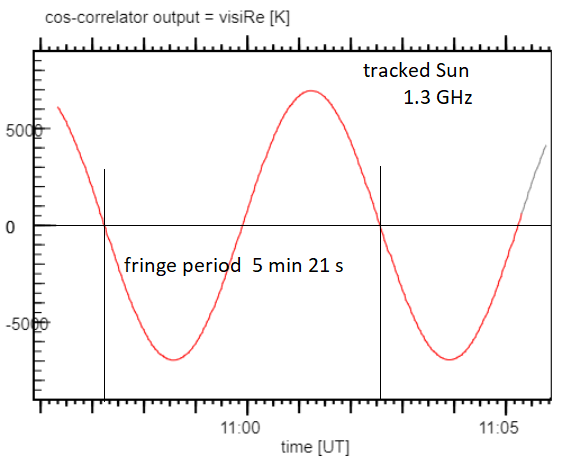
For an E-W interferometer, the period of the fringes is 1/u = λ/b as a function of sin(θ) or 1/(u cos(θ) as a function of θ. Here, ueff = b cos(θ) / λ is the separation of the antennas measured in wavelengths and as seen from the direction of the source. A source at declination δ seen by an observer at hour angle h has an angle θ off the instrument's median line. For an E-W interferometer this is sin(θ) = -sin(h)*cos(δ) (Eq. (3) of Moffet (1962)). For a transit across the median line (h = θ = 0) the speed in θ is given by: dθ/dt = -cos(δ) * dh/dt with the speed of the sky rotation of dh/dt = 360°/24 h.
The visibility measures the strength of the fringes: Measuring the linear signal power - note that the powers are given in dB - at the peak (pmax) and the trough (pmin) and calculate
V = (pmax - pmin) / (pmax+pmin)
When a source is unresolved by the instrument, the fringes are large and V = 1; a fully resolved source shows no fringes, hence V = 0. - Correlation Interferometers: Soon it was realized that by phase-switching
(M.Ryle, 1952, Proc.Roy.Soc.A 211, 351) or continuous multiplication
of the signals (E.J.Blum, 1959, Annales d'Astrophys. 22, 140)
interferometers can be operated in a better and more efficient way, as one
looks at the correlation between the signals from different antennas. This
is now the way all interferometers work.
Consider the 2-antenna interferometer depicted in the figure above. The time delay of the wavefront arriving at the antennas gives rise to a phase difference of φ = kb sin(θ) = 2π b/λ sin(θ) between the output voltages of the antennas: U1 = U0 cos(ωt + φ/2) and U2 = U0 cos(ωt - φ/2)
In the adding interferometer the two voltages are added at the receiver input. The amplitude of the sum signal is its time average: < U1 + U2 > = 2 U0 cos(φ/2) and the received power is P = < U1 + U2 >² = 2 U0² (1 + cos(φ))
In the correlation interferometer the signals from the two antennas are multipied with each other and and time-averaged. For easier manipulations we write this in complex form:
U1 = U0 exp(-jωt + jφ/2) and U2 = U0 exp(-jωt - jφ/2)
This gives:
< U1 * U*2 > = U0²< exp(-jωt + jφ/2) * exp(jωt + jφ/2) > = U0²exp(jφ) = U0²(cos(φ) + j sin(φ))
The correlator thus provides two outputs: the real (cosine) and the imaginary (sine) parts of the visibility. It is convenient to record these as visibility magnitude and phase; often the magnitude is called the visibility amplitude. - General recommendation: Our interferometer's baseline lies in the East-West direction. Its response pattern is a series of sinusoidial fringes in North-South direction. Thus it is best employed when the source transits across the southern (or northern) meridian. In this way, the full baseline is available for maximum angular resolution. One may observe sources also in other directions, but sources in the easterly or westerly directions are faced with a foreshortened baseline (b cos(az)), and thus can only be measured with a reduced resolution.
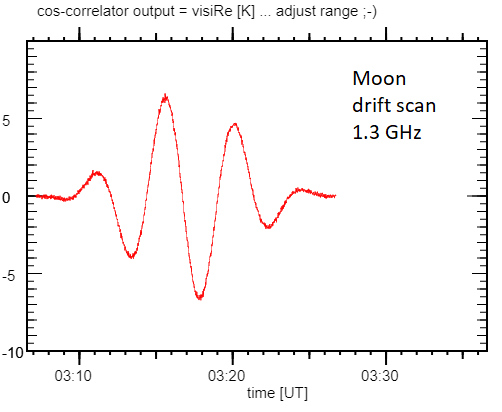
- Measure the fringes: The fringes from a correlating interferometer
are visible in the real or the imaginary part of the visibility.
- choose "Correlating Interferometer: correlator cosine output"
- use a small antenna to get a HPBW larger than the object
- Startup
- choose the object "Sun"
- click "Goto" or "Go & Track"
- record the data
- since the plot shows the real part of the visibility in units of K antenna temperature, the user is required to select suitable ordinate ranges. It helps to detect the start of the red trace when you first chose a short Xspan of 2 min ;-)
The fringe period is accurately measured by tracking a source, such as the Sun:
- Measure the source diameter: This can be already done with a 2-element
interferometer by increasing the separation of the antennas, and searching the
baseline at which the fringes disappear for the first time. A source which is
a disc of uniform brightness and angular diameter δ, it can be shown
that the fringes disappear when the difference in path length is one wavelength,
i.e. b sin(δ) = λ.
This technique was employed already in 1920 by Michelson who determined the angular diameters of stars with an optical telescope.- choose "Correlation Interferometer"
- preferably use a small antenna to get a HPBW larger than the object
- Startup
- choose the object "Sun"
- click "Go & Track"
- enter a trial value of the "Antenna separation", click the button "Single measurement"
- search for the first null of the visibility curve, i,e, the lowest value of u where the visibility amplitude becomes minimal.
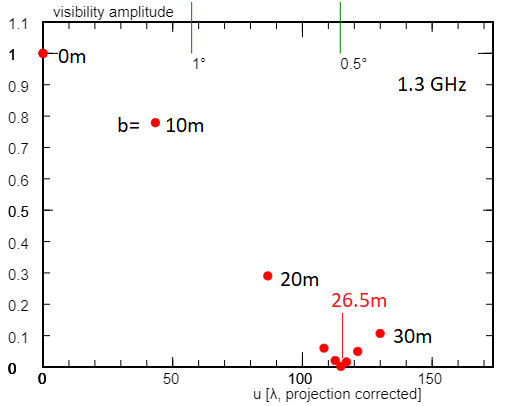
The green marks indicate that the Sun has an angular diameter of about 0.5°. - Visibility function: The magnitude (or amplitude) of the visibility as a function of the spatial frequency u = b/λ = baseline/wavelength contains the information about of the structure of the apparent image of the source, as seen by the interferometer. Low values of u mean large-scale structures, high values of u mean fine structures. It can be shown that for interferometers with small antennas with their wide beams the visibility function is the Fourier transformation of the angular brightness distribution of the source. To reconstruct the radio image of a source, one wants to determine as much of the visibility function as possible.
- Collect visibility measurements: Already with an interferometer of only two
antennas one can get the visibility function. The trick is to make one of the antennas
movable, so that we can measure visibilities at various antenna separations. Of course,
in reality this would take time to move the antenna etc ...
- choose "Correlation Interferometer"
- preferably use a small antenna to get a HPBW larger than the object
- Startup
- choose the object "Sun"
- click "Go & Track"
- enter a trial value of the "Antenna separation", click the button "Single measurement"
- the measurements taken so far can be shown in the visibility plot by clicking "Show and output collected visis". Then these measurements can be taken from the "Output" page as a small table. The "Reset" button wipes all previous measurements for a fresh start.
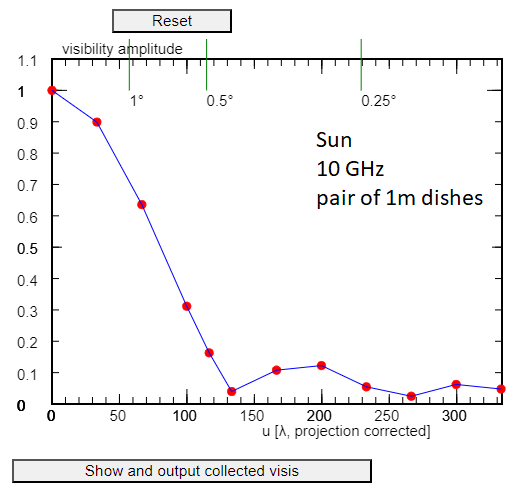
Interpretation: The visibility amplitudes can be taken directly. The phases can be computed from the position of the source (and the antennas, because we track the source). This is done for each measurement as follows- The angle θ with respect to the median line of the interferometer is:
sin(θ) = -cos(el) * sin(az) - The current baseline gives the spatial frequency u = baseline/λ and hence the visibility phase φ(u) = 2π u sin(θ).
- Note that φ is a multiple of 2π, which gives the index of the fringe employed at that measurement.
- To get the reconstructed image, we apply the inverse Fourier transform on the visibility curve. This is usually done with a computer routine performing the FastFourierTransform FFT, which requires as input the data on an evenly spaced grid of u values, whose number must be a power of 2. Since we have only a couple of measurements, we need to interpolate our values on such a linear u-grid.
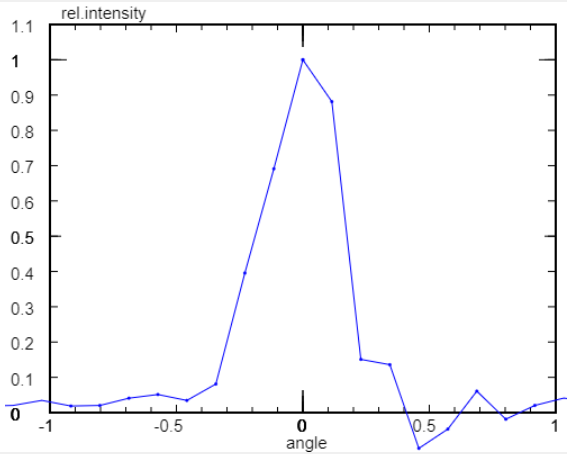
For the convenience of having the image centered in the plot, we also shifted the phases of all measurements by Δφ(u) = 2π u shift by shift = 2.3° in radians. - Measure the visibility of faint sources: For faint sources, a single measurement
done with the small dishes very likely will contain noise. Thus it would be preferable to
make several or many measurements and take their average.
- choose "Correlation Interferometer"
- preferably use a small antenna to get a HPBW larger than the object
- Startup
- choose the object "Sun"
- click "Go & Track"
- click "Record"
- to change the baseline, enter a value of the "Antenna separation". This change will be marked in the output data.
- Measure visibility function by N-baseline interferometer:
It is a very tedious and laborious way to construct the visibility function
from single measurements with an interferometer of only two of a few antennas.
Therefore, very soon instruments with many antennas were built.
We have the option of "N-baselines" where a number of antenna are arranged in such a way, that data for a number of equally spaced baselines are produced.- choose "N-baselines Interferometer"
- select the number of baselines
- choose the maximum baseline
- preferably use small antennas to get a HPBW larger than the object
- Startup
- choose the object "Sun"
- click "Go & Track"
- "Record"
- the visibility plot will show the obtained visibilities as red points. After 10 measurements a blue curve for the average values is plotted. The visibilities may be shown with linear or logarithmic ordinates. The "Reset" button makes a fresh start.
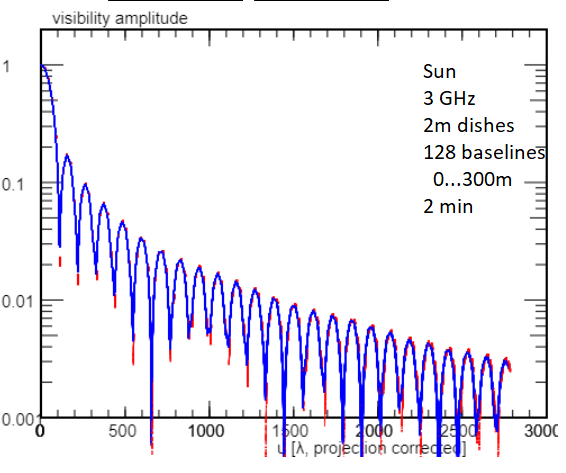
Interpretation: The table at output gives all information of all the measurements. The analysis is best done with a program, written around a module which performs the inverse Fourier transform (convieniently done by FFT) to get the reconstructed images. Here we show as example an observation of the Sun, when 132 measurements were taken within about 2 min:
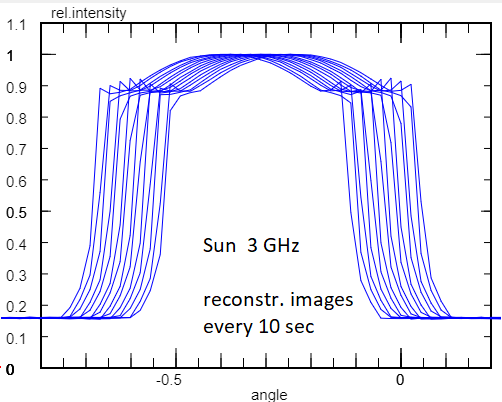
During the 2min the Sun moved by about 0.5°. Thus each reconstructed image shows the Sun at a different position - the plot above shows every 10th position. In order to combine all the data into a single image, the phases need to be adjusted to the time and position of the source at the meridian or the first measurement.- The aim of this compensation is to bring all the phases of the visibilities at all baselines
and measurements all as close to zero as possible, so that the visibility curve becomes nearly
a real value function.
Since the source positions are known for each measurement, the angle θ between the source position and the meridian is computed as: sin(θ) = -cos(el) sin(az)
with which the phase difference to the source at the meridian is calculated for any baseline u:
Δφ(u) = 2π * u * sin(θ)
This works well, but it seems that with a little bit of manual adjustment one can reach better results from noisy data .... - In this approach, we first look at the first image and put it in the middle of the plot:
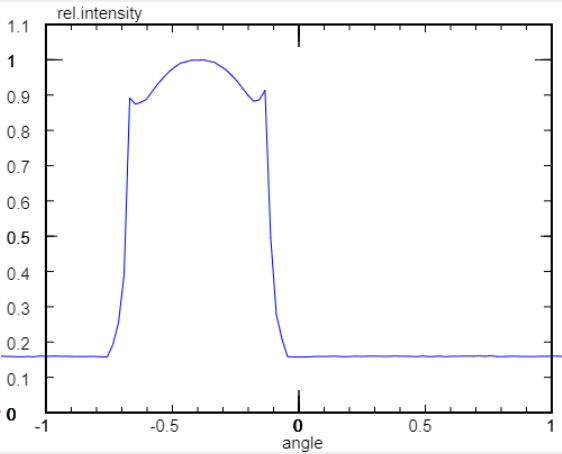
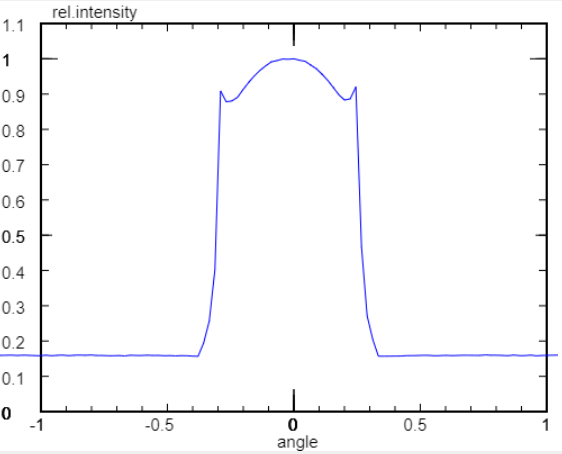
This is done by shifting the phases of the visibilities of the baselines u by an amount
Δφ(u) = 2π * u * (π/180° * shift)
where shift is a suitably chosen shift angle in degrees. Here, shift = 0.35°. - Next, we consider all the data: their phases are shifted in the same way as was done with the first
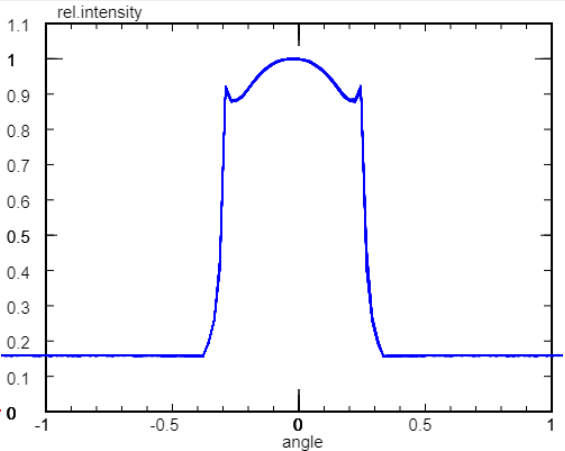
image, but then we apply a second compensation for the difference in time to the first image by
using a second phase shift which also depends on the index i for the individual measurement:
Δφ(u, i) = 2π * u * d sin(θ)/dt * (ti-t0)
For a transit over the local meridian, we can neglect the changes in elevation and use
Δφ(u, i) = 2π * u * cos(az) * cos(el) * daz/dt * (ti-t0)
and use instead of the actual speed in azimuth daz/dt a free parameter to get the best overlap of the data. In this example, we used daz/dt = -0.00415 °/s (but expressed in radians/s) so that all the 132 images fall into a single one:
For the Moon there is more noise in the visibilities at high u-values. But the average visibility amplitude (blue curve) seems quite well defined:
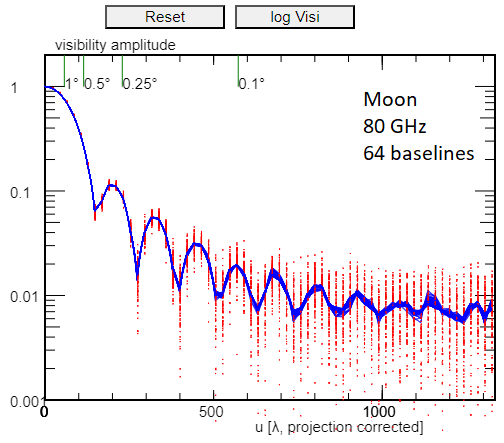
The amplitudes of all visibility curves can simply be averaged. The phases are shifted in the same way as described above for the Sun, resulting in the average:
| Top of the Page | ESA-Haystack radio telescope on 1420 MHz | ESA-Dresden radio telescope (10-12 GHz) | Website of DL0SHF Radio Observatory and Ground Station | Astropraktikum: Radioastronomie | my HomePage |