The Antenna's Radiation Pattern
Joachim Köppen Strasbourg 2009
The radio telescope's parabolic dish antenna is designed to concentrate the view into a small region. Or, if we were to use it on transmission, the radiated energy would be concentrated into a small angle in the sky. One speaks of the angular width of the antenna "beam" or "main lobe". It is useful to characterize it by its full width at half maximum power: Half Power Beam Width (HPBW).
Because electromagnetic radiation is in the form of waves, it is the diffraction of the waves impinging on the finite size of the antenna dish which determines this angular width. The HPBW is determined by the diameter of the antenna, measured in wavelengths:
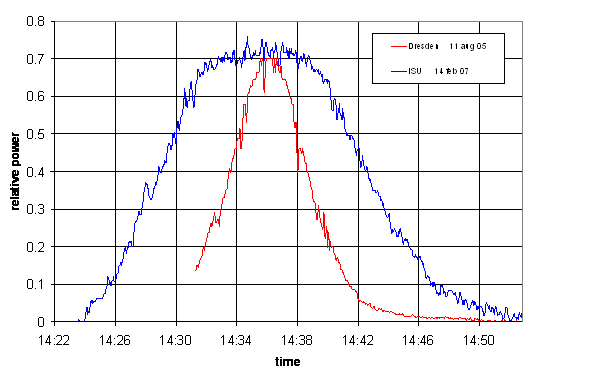
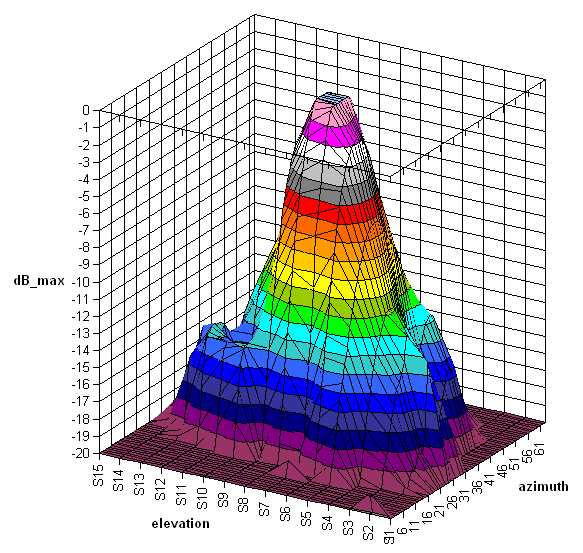
When doing a drift scan across the sun, one simply measures the radiation pattern in the horizontal plane. The sky's apparent rotation makes a time intervall of 4 min correspond to 1° in angle. The plot below compares our results with the measurements of the prototype telescope. It can be seen that the prototype's HPBW was about 1.4° (as expected), but our antenna has a much broader beam of about 3.75 deg ...
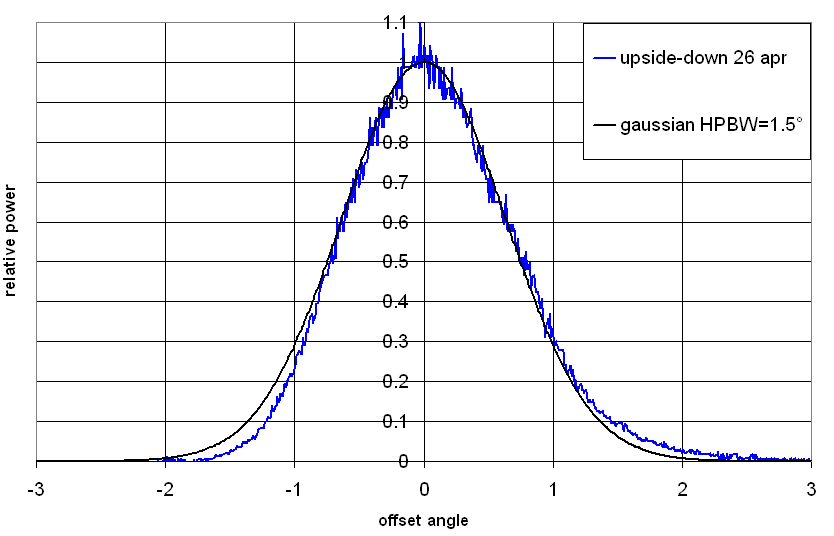
Here is a JAVA applet which computes the radiation pattern of a square- or circle-shaped parabolic dish antenna. Click on Clear to start, enter Wavelength 2.5 (in cm), Dish diameter 120 (also in cm), and click on Compute Far Field to get the pattern when we look at large distances, as we do here. You can change the Y-axis to show the signal linearly (in V, but normalized to 1.0 at the maximum) or in dB. Also you can change from uniform illumination to perhaps a more realistic cosine law; what the real illumination of the dish by the LNB is, we don't know ... but this also affects the width of the antenna beam ... we can find out by measuring the HPBW (half-power beam width: the point at -3dB or at 0.71 in linear representation), which is 1.4 deg with cosine illumination but 1.0 deg with uniform illumination ... if you click with the mouse on the plot, it will show the x and y coordinates of that point!
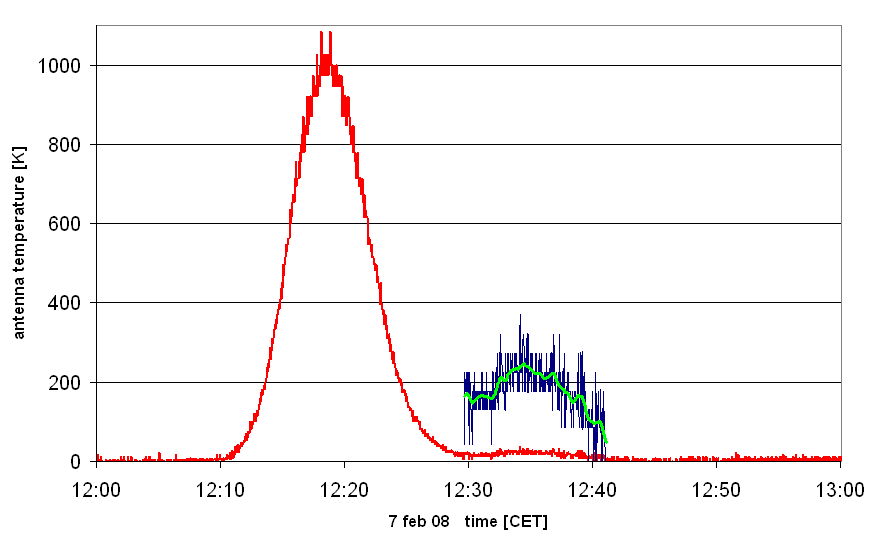
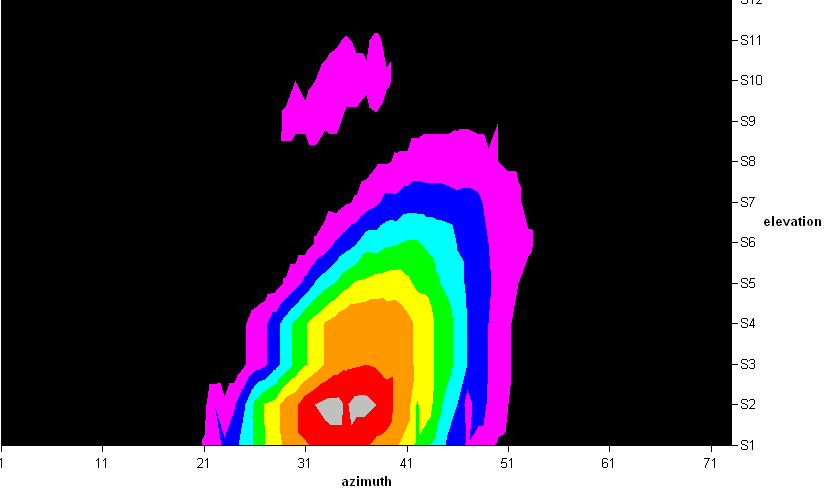
Then we began to measure the antenna pattern both in horizontal and vertical direction, by observing the transit of the Sun every day, as it moved higher and higher up in the sky in late winter 2008. This contour plot shows the raw data obtained by Marina Lemberg, which are not corrected for the slight daily azimutal shift of the Sun. The colours indicate the different levels of sensitivity from the maximum (gray, red) downward:
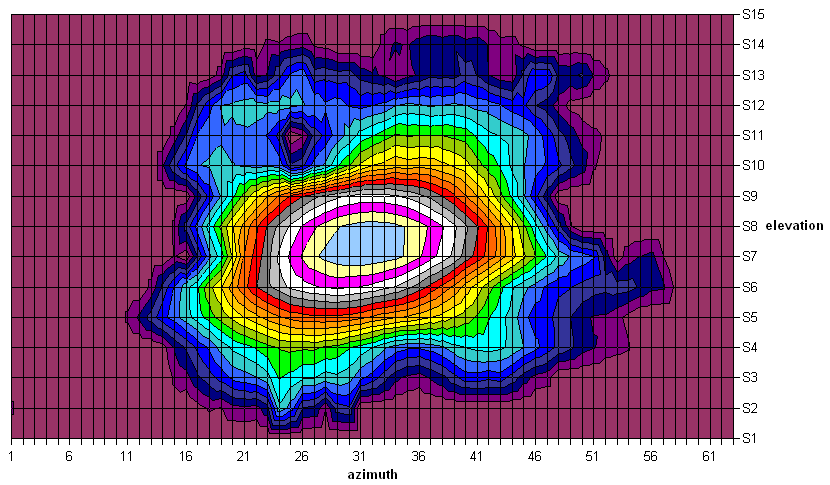
Another run could successfully cover both sides of the pattern. The nearly circular contours in the centre of the plot show that the pattern is quite symmetric. However, the outer contours indicate the presence of two pairs of "feet" in the pattern: a stronger one (upper right and lower left) but also a fainter pair at upper left and lower right. Since our dish is slightly distorted due to its initial been blown over by a strong wind, we suspect that the feet - which are point-symmetric to the centre - could be the result.
| Top of the Page | Back to the MainPage | to my HomePage |
last update: Apr. 2013 J.Köppen