The Antenna Pattern
Joachim Köppen Strasbourg 2010
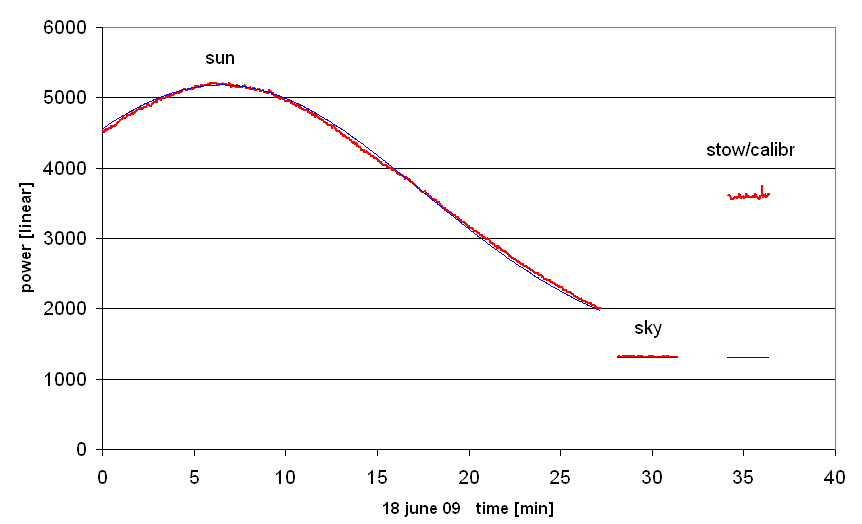
Our first solar observation on 18 june 2009 was a Drift scan in which we let the Sun pass through a position where the fixed telescope is pointing. The data recorded shows therefore a peak flux when the Sun moved through the main lobe of the antenna:

By fitting a gaussian curve (the thin blue curve) to the solar data, we determine its width sigma = 11.04 minutes of time. As the Sun was at declination +23.40°, it moved across the sky with angular speed of 0.25°/min*cos(declination), so we can express sigma in degrees. The half-power beam width of the gaussian curve is given by HPBW = 2.3548*sigma. Taken all together, this gives a HPBW of our antenna of 5.95°.
But we also notice that the measured curve deviates from the gaussian curve slightly, but significantly ...!
A more recent observation - in the same manner - gave HPBW = 6.2°
| Top of the Page | Back to the MainPage | to my HomePage |
last update: Apr. 2010 J.Köppen