The other aspect is about the telescope: Since the empty sky provides radio wave emission only at negligible intensity, the signal that we measure is essentially the background noise from our receiver. Comparing the solar signal with that of the sky we obtain a measure of the sensitivity of our instrument: The larger the ratio of the solar and sky signals is, more sensitive is the system. We express this more quantitatively as the System Temperature.
The third aspect is also technical: We can determine the width of the antenna pattern, i.e. the Half-Power Beam Width (HPBW) which describes also the angular resolution possible with the antenna. This is done by letting the Sun - which we use as a source with a constant signal - pass through the antenna beam, and measure the time it takes. With the knowledge of the Earth rotation's angular velocity we convert the time interval into an angle, the HPBW.
Observational procedure
After starting up the system, we recommend to follow this sequence:
- still at Stow position, measure the power. You may start Record to keep all following results in a file, or only write down the value of the Pwr displayed.
- Make sure that the Point.Corr. are Az = -0.5° and El = -3.5°. If not already done, enter these numbers in the fields and hit the return key. At the lower right there should appear the corresponding message in blue text. This correction of the pointing is necessary for the telescope to find the true positions in the sky!
- The choice of the frequency is not important, but it is convenient to have a frequency span of 500 kHz, because this gives the most rapid measurements.
- after a minute or so, click on the dot for the Sun. Depending on the time of the day, it may take some time for the telescope to move there. Because of the pointing correction, the red cross will be somewhat below the dot indicating the Sun. That's OK!
- when the first data appear you may take note of the power value, which should be higher than in the stow position. If you are not already recording data on file, now it would be time to click the Record button. The button text should now be blue.
- now click the DriftScan button. The telescope will move to a position to the west, where the Sun will pass through in a few minutes.
- now lean back, wait and watch. The signal power - indicated by the red curve at middle left will slowly go up, and then down as the Sun leaves the antenna beam. Wait until the red curve has become truly horizontal: this indicates that the Sun moved so far away that we are measuring the signal from the empty sky.
- after you got a bit of constant signal (for about one minute), you can stop this observation by clicking the Record button, so its text becomes black again. Careful persons may also want to return to Stow and remeasure the power, in case it may have changed during the observation time! Now you or someone else can turn to other observations ... If not, then return to Stow and shut down the system.
- You find your recorded data in the text file at: C:/SRTcassi, named: year/month/day/time.txt for example: 1004141630.txt if I observed starting at 16:30 on April 14th 2010 (all times are given in UTC). Copy the file to your USB stick or flash drive to transfer onto your computer.
Analysis
Let's suppose that we use Microsoft Excel to do the interpretation of the data. Then we recommend to follow this sequence:
- To import your text file go to: File -> Import-> Text File -> Select your Text File -> Delimited Text file -> Delimiter is spaces -> Finish
- Each row represents a single spectrum taken by the telescope at a certain time instant. The columns from left to right represent: Time, Azimuth, Elevation, offsets in azimuth and elevation, velocity with respect to the Local Standard of Rest (LSR), the first frequency in the spectrum, the frequency increment, an integer number indicating the frequency mode, the number of frequency points in the spectrum, followed by the flux at the first frequency all though to the flux at the last frequency.
- We shall need only the times and the fluxes
- Insert a new column right after the first column. Fill the cells with the AVERAGE of the flux values in this row. However, leave out the first eight and the last eight cells. Do this for all the rows in your data.
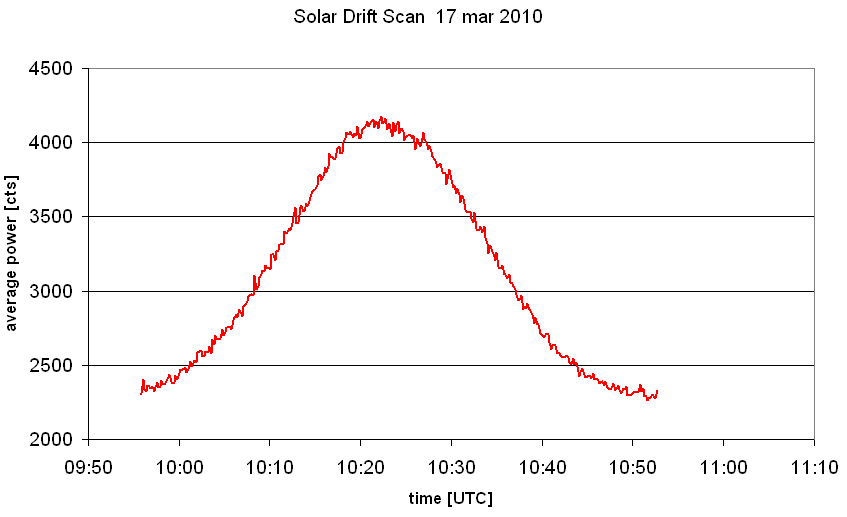
- Now make a scatter plot of the first two columns, which gives the average
power as a function of time. After some cosmetics it may look like this:

- From this plot, we can determine the maximum signal of the Sun
(here: F_sun = 4150 cts),
the background level of the empty sky (F_sky = 2300 cts), and we have the
measurement at stow from the emission of the library wall calibrator
(F_cal = 3100).
These numbers allow us to compute:
- the true signal of the calibrator: F_cal-F_sky = 3100-2300 = 800 cts which corresponds to the calibrator's temperature of about 290 K
- the true signal of the Sun: F_sun-F_sky = 4150-2300 = 1850 cts, from
which we compute the Sun's antenna temperature as
T_ant(Sun) = (F_sun-F_sky)/(F_cal-F_sky)*T_cal = 1850/800*290 = 670 K
- Next, we look at which times the signal was halfway between the maximum and the sky, that is where its value was (4150+2300)/2 = 3225 cts. Here, the result will be: 10:10:34 and 10:34:38. This makes 24 minutes and 04 seconds for the time the Sun passed through the antenna beam, at its half-power points.
- The Earth revolves once in 24 hours, or 15°/hr or 0.25°/min. Thus, the 24 minutes give 6° as the Half-Power Beam Width of the antenna. A more accurate value is obtained, if we take into account that depending on its actual declination d the Sun moves with somewhat slower speed of 0.25°/min*cos(d). The declination of the Sun you may obtain from this tool. In our example of data taken close to the spring equinox this correction is minute.
- With the antenna's HPBW known, we now can derive the temperature on the surface
of the Sun: Since the Sun has an angular diameter of about 0.5°, much smaller
than the antenna beam, its temperature must be correspondingly hotter than
the library wall which fills the entire antenna beam. Thus the true solar
temperature is
T_sun = T_ant(Sun) * (HPBW/0.5))² = 96500 K You may be surprised about such a high value ... but this is the temperature at the bottom of the corona, which is the outer layer of the Sun which we observe at 1.4 GHz! If we could observe at even lower frequencies, we would get values up to a few million K! - Finally, we can derive the system temperature of the telescope, from the
formula
T_sys = T_cal / (F_cal/F_sky - 1) = 290/(3100/2300 - 1) = 833 K This rather high temperature indicates that our receiving system is not yet optimal, as one should expect for this telescope about 200 K or a bit less.
You might wish to do a more sophisticated analysis by fitting a simple model to the data:
- We assume that the signal is composed of a Gaussian function representing
the antenna pattern and a constant background:
F(t) = F_sky + S_sun * exp( -0.5((t-tmax)/s)² ) with the free parameters- F_sky ... the level of the background
- S_sun ... the true level of the sun's radiation
- tmax ... the time of the maximum power
- s the width of the Gaussian in time units.
Note that in Excel time is measured in days, so that
s = (HPBW/2.3548)/(360° * cosd) in all beauty
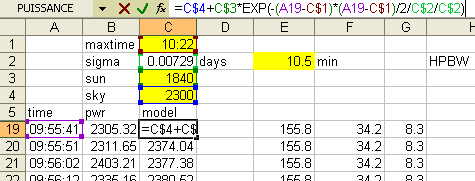
- Insert a new column after column B, and also add a couple of rows into which
you can place the cells that will old the free parameters. Fill the new column
with the predicted flux levels, as shown below:

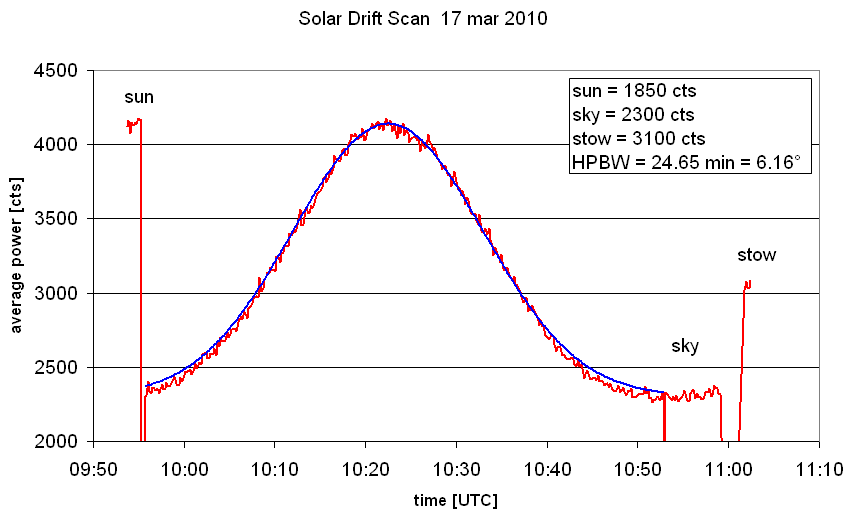
- Make a plot of the observed and predicted fluxes as functions of time, or
simply add the model curve to your existing graph. Now adjust all the parameters
until you get a best match of the model curve with your observations, such as
shown below:

- The plot shows quite clearly that the assumption of a Gaussian profile for the antenna pattern is not quite perfect. The sensitivity of the main lobe drops a bit faster than the Gaussian. Also, it would have been better to execute a bit more patience after the drift scan to let the curve go really flat ... but my excuse is that at that time i moved the telescope 90° off to the East, to get the sky really far away from the Sun ;-)
Our results
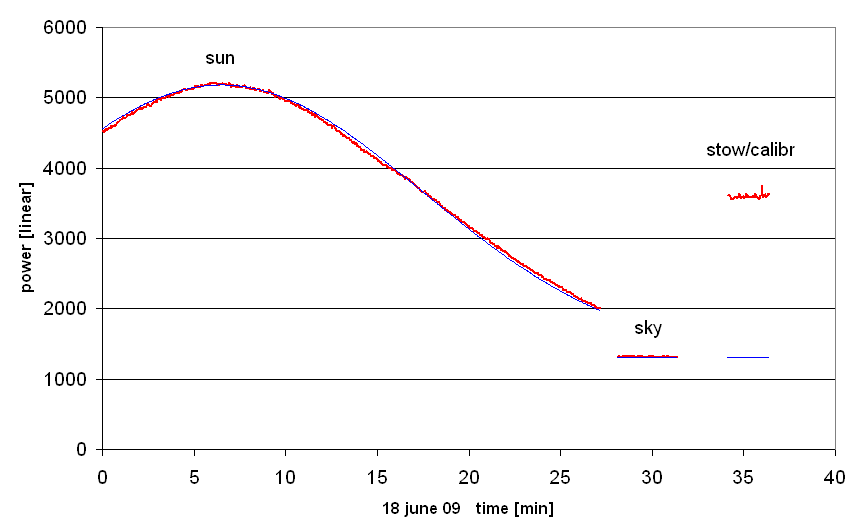
Our first solar observation was done on 18 june 2009, the day of First Light:

- the level of the background: 1317 cts
- the height of the maximum solar signal (background subtracted): 5180-1317 = 3863 cts
- the level corresponding to 290K: 3599-1317 = 2282 cts
- the antenna temperature of the Sun's peak signal: 290K * 3863/2282 = 491 K
- by fitting a gaussian curve (the thin blue curve) to the solar data, we determine its width s = 11.04 minutes of time. As the Sun was at declination d = +23.40°, it moved across the sky with angular speed of 0.25°/min*cos(d). Taken all together, this gives a HPBW of our antenna of 5.95°.
- deviations of the measured curve from gaussian curve are slight, but significant!