The Lagrangian Points
Joachim Köppen Kiel/Strasbourg/Illkirch December 2001
Contents
The Lagrange Applet
When you start up the applet, you hit the ClearAll button, and you see something like the following screen:
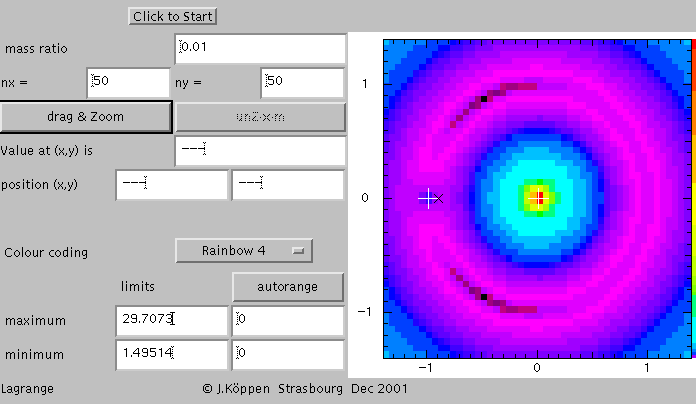
The picture shows a colour coded representation of the effective potential. This is done for a spatial grid of 50 by 50 points in x and y direction in the orbital plane of the massive bodies. Their mass ratio is 0.01, similar to that of the Earth-Moon system. The colours indicate the value of the potential, black means the minimum value of 1.49514, red the maximum of 29.7073, yellow about the middle (i.e. 15), and the other colours of the rainbow for intermediate values. The positions of the two massive bodies are marked with the large (white or black) crosses. The smaller black "x" mark the position between the two bodies where the gravitational forces balance each other.
What this picture shows are two sharply peaked "mountains" at the centres of the two masses which rise from what seems to be a plane of blue "flatland". Outside of the region shown, this flatland rises again! But the violet area indicates the presence of a ring-shaped "ditch" around the more massive body. This has two darkly marked low areas, the lowest points of which are the stable Lagrangian points L4 and L5.
The lowish violet region also surrounds the position of the smaller mass. We now zoom into the region between the two massive bodies:
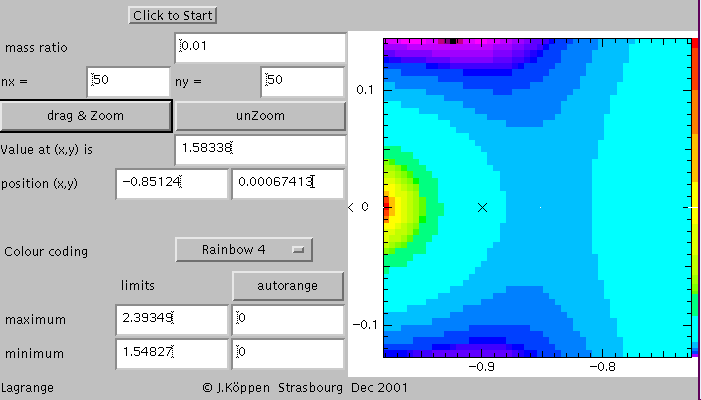
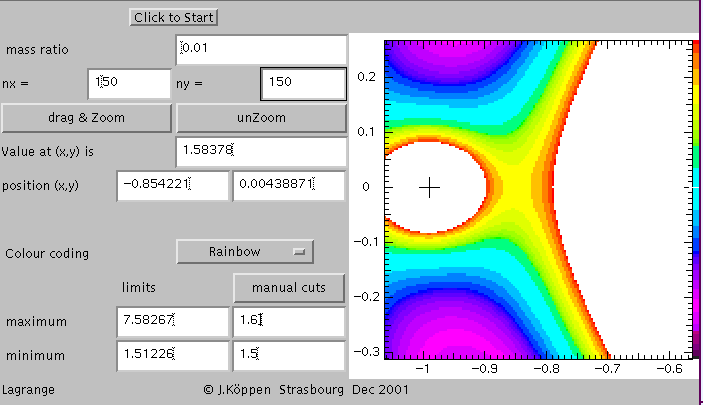
Here I've marked one point, at about x = -0.85 and y = 0, by clicking on the screen. This gives a display of the coordinates and the value of the potential, and it leaves a small white dot on the screen. One may verify by probing the neighbourhood, that this point is a saddle point: the potential rises to either left and right, but decreases towards the top and the bottom. This is the Lagrangian point L1. Note that it does not coincide with the point where the two gravitational forces balance each other, because the effective potential also takes into account the centrifugal force due to the rotating system of our view! The next plot is the same area, but here we clicked on the autorange button to change over to manually set cuts, and set the black end to 1.5 and the red end to 1.6. This shows how we can zoom the third dimension. Also we now use a finer resolution of 150 by 150 points to bring out the detail:
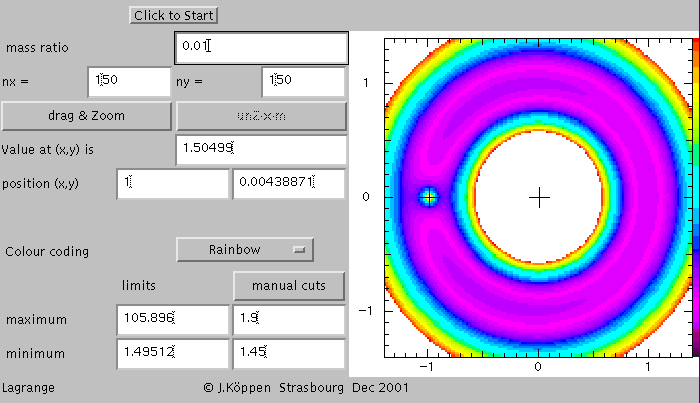
The second Lagrangian point L2 is the saddle point that can be found on the exterior side of the smaller body. Now we have an unzoomed view, and we had clicked at the third Lagrangian point L3 which is the saddle point on the exterior side of the more massive body. This view also shows that from L3 there stretches a long "valley" towards L4 and L5. This is the route that is taken by satellites in the horseshoe orbits.
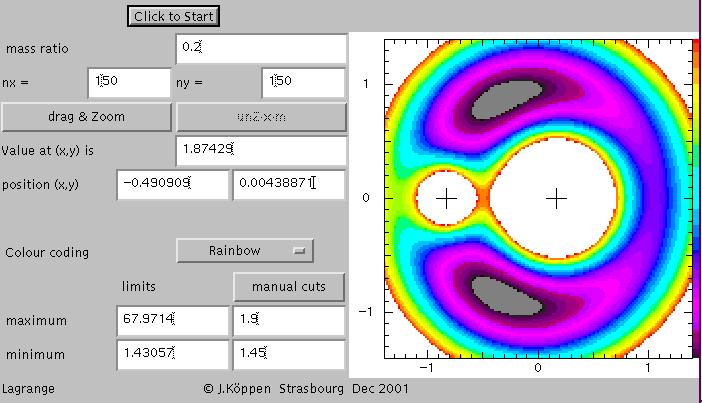
We now changed the mass ratio, and one notes that the structure changes somewhat, but that the fundamental property of having two stable points and three saddle points remains:
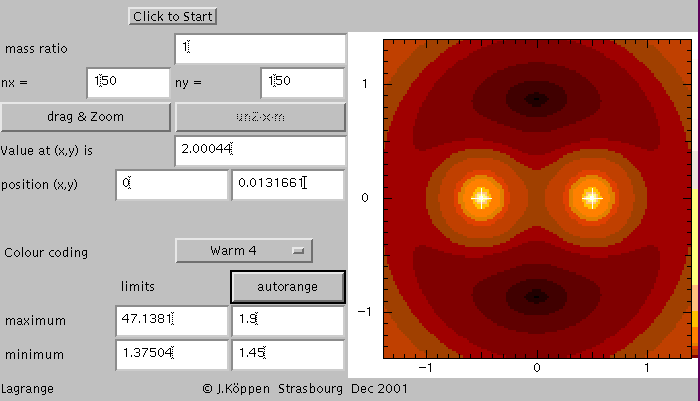
For equal masses and another colour scheme, we get this:
| Top of the Page | Controls | Applet | Applet Index |