Three Bodies in Gravitation
Joachim Köppen Kiel/Strasbourg/Illkirch Oct.97
Contents
This same model pertains to the orbit of a interplanetary spacecraft around the Sun and being perturbed by any one of the Planets, such as Earth or Jupiter. When the spacecraft passes very closely to such a planet, it may obtain or lose any amount of energy, thus making possible to make cheaply large maneuvers by the "swing-by" technique.
Since both the problem is more complex than the simple Kepler problem, and also this Applet itself is more complex and offers more options, I very strongly recommend to fully master the Two Body Simulation before one can make fully use of the ThreeBodySim Applet. For explanations of a number of more basic things, I refer you to the help screen .
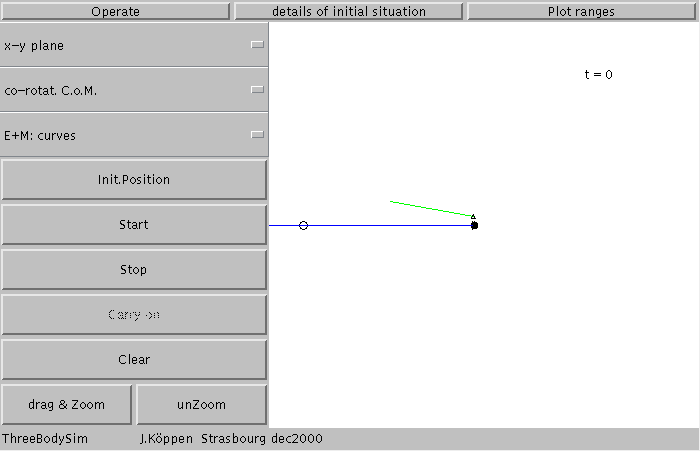
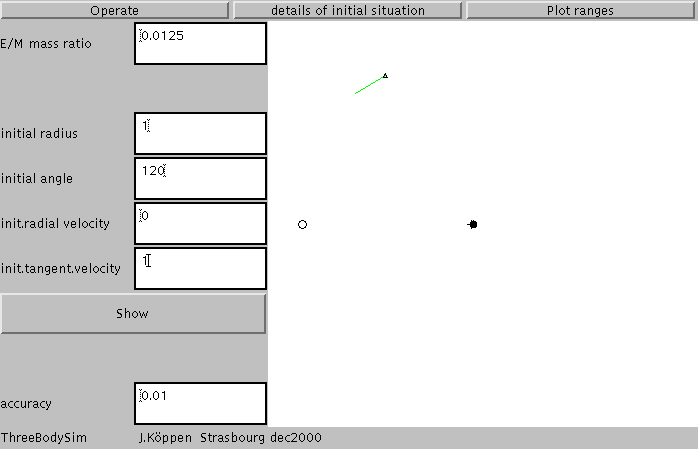
After the applet came up and you've clicked the Clear button, you'll see this screen
The black ball symbolizes the Earth, the white ball the Moon, connected by a blue line. The small triangle is spacecraft at its start position. The green line points in the direction of departure, with the length giving an indication of the insertion speed. In the upper right hand corner there is an indication of the current time, in units of the orbital time of the Moon, i.e. in months.
At the top, there are the buttons to reach three pages: Operate which is this one. The others, details of initial situation and Plot ranges will allow us to inspect and influence further details.
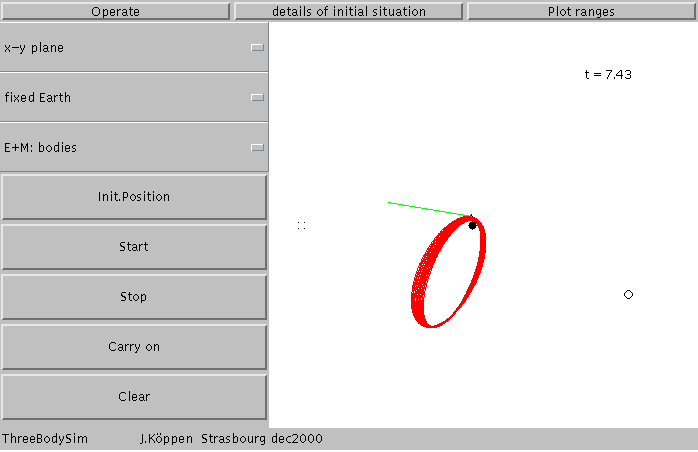
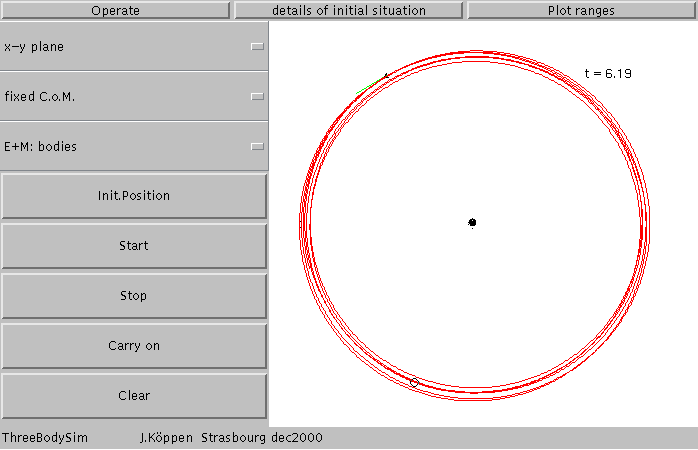
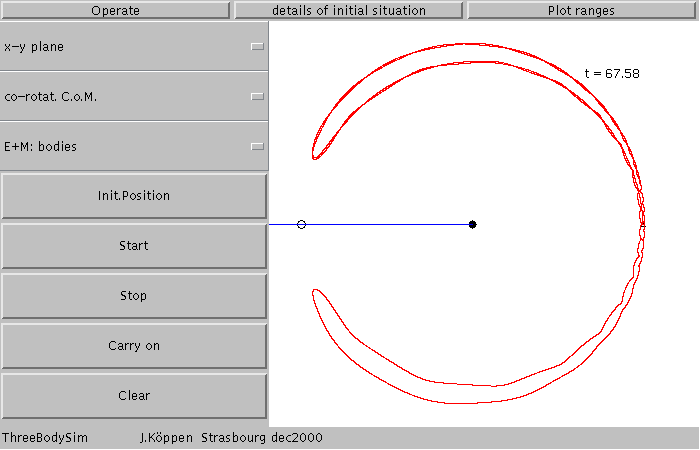
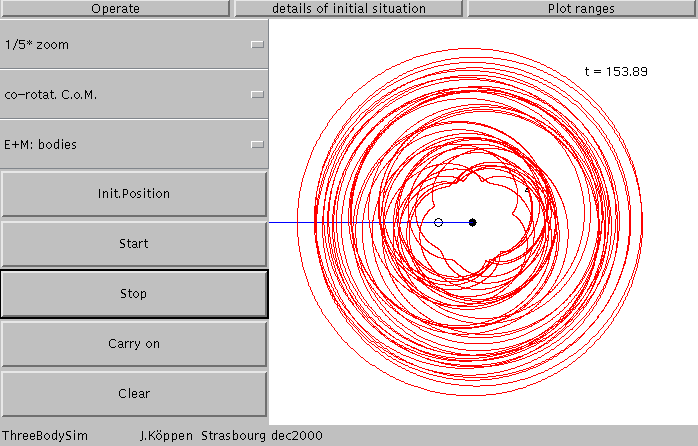
The controls panel tells us that we look at the orbital plane of the Moon (the x-y plane), and we look at it as if we were sitting in the Centre of Mass (you may distinguish a cross in the centre of the plot screen) and rotating so that the Moon appears to remains always in the same position. The orbits of Earth and Moon are to be represented by curves. There are a couple of buttons, the most interesting being Start. This is what you get after having tried of the Stop button:
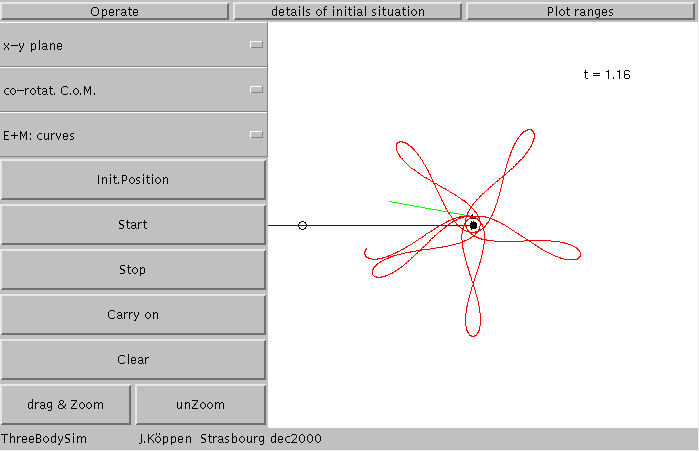
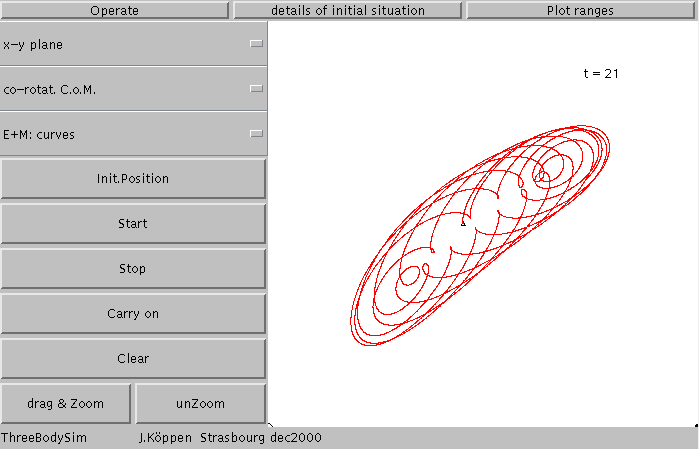
which seems to be an interesting orbit which takes the spacecraft close to the Earth and reaching out away from it, like petals of a flower. We've got five petals in one month of flight. Let's Carry on and after about one year we get this:
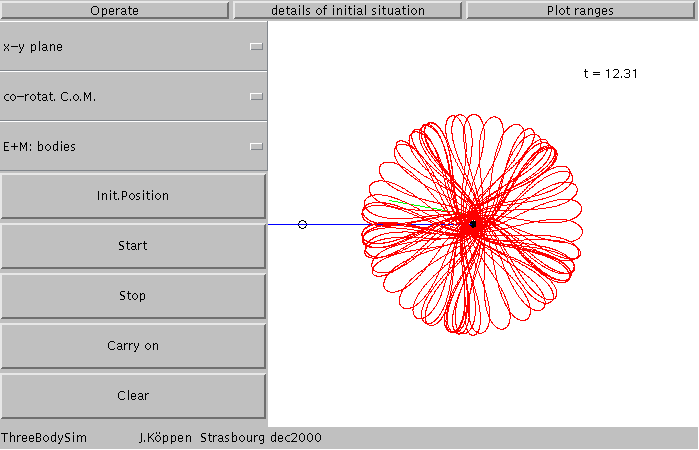
Don't get upset if the controls on this picture seems to have changed. I used a slightly older version to make this and other screen shots. We see that we remain in Earth orbit, but that the trajectory is not what we would call a nice regular rosette.
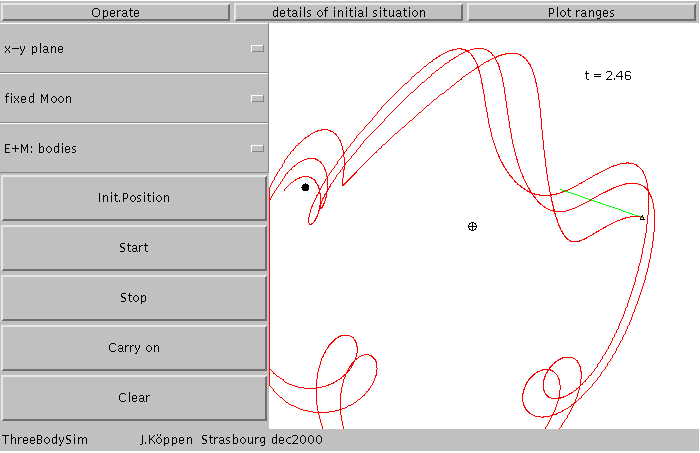
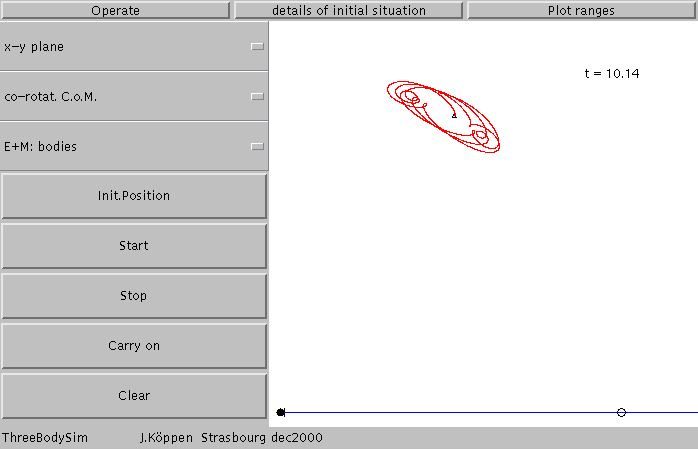
Now this was done from a coordinate system centered in the Centre of Mass, rotating with the moon. Let us change over to the (non-rotating) system fixed in the Centre of Mass, and the same simulation looks rather different:
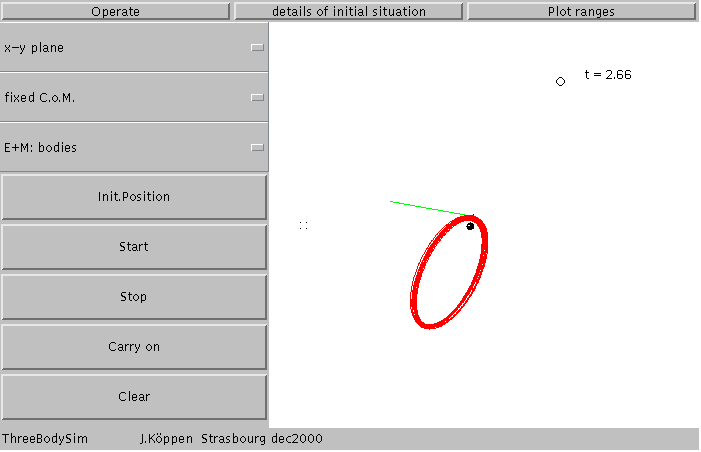
We have also switched the representation of Earth and Moon from curves to bodies which shows them as both move in circular orbits about the Centre of Mass. The motion of the Moon appears to be jerky: this is because in the calculations we automatically adjust the time step in order to keep a good accuracy. The time step is shortenend when the satellite moves faster, for instance when it passes close to the Earth and speeds up.
The orbit is now revealed as an elliptical orbit, but it appears as a thickish trace, so it's not a simple Kepler ellipse. It is perturbed by the Moon.
Again the same thing, but now seen from the Earth. The orbit is a long ellipse, but still not a perfect one, as it precesses anticlockwise and also seems to change its shape.
and this is how the motion of the satellite would appear to somebody standing on the Moon:
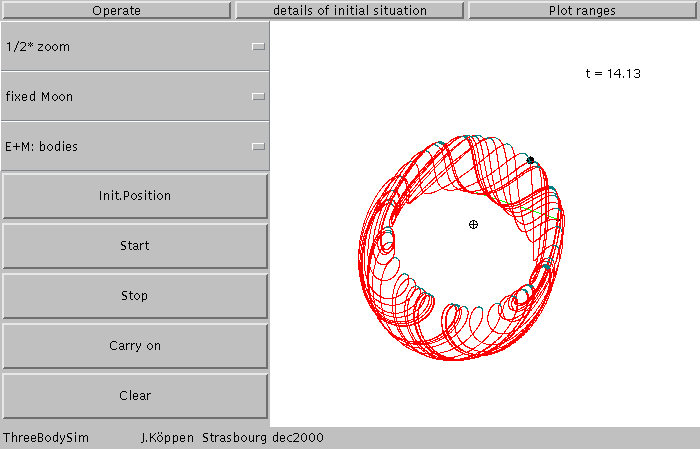
Since not all fitted on the screen, we can use a smaller scale (we may zoom out by 2, 5, or 10 times). What we see here is that after some time the orbit as seen from the Moon is not completely weird, but has some structure: when the satellite is closest - as in the top right - it just passes over the lunar sky. But when it is rather far away (lower left), it makes a reversing loop.
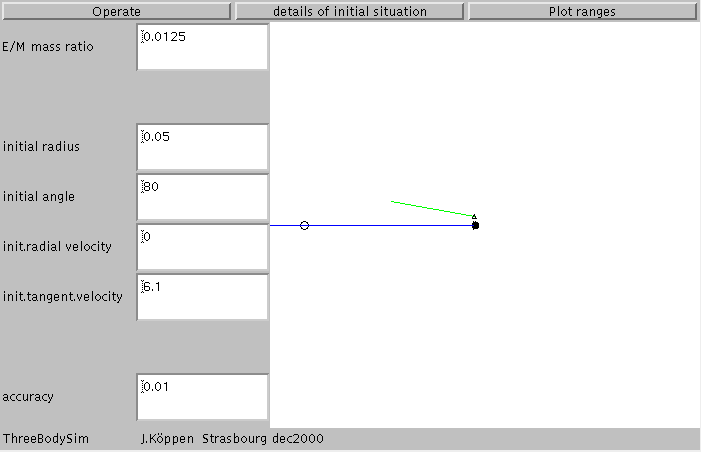
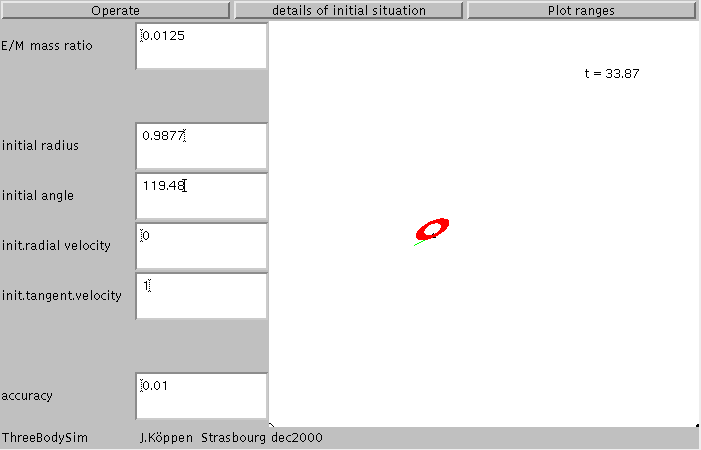
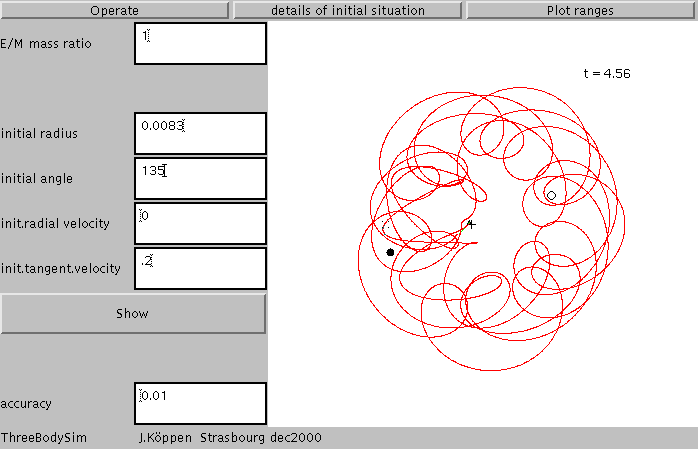
To see more about the initial conditions of the satellite, we click Details on initial situation which brings up a page with the relevant information: Here, we see that the mass ratio of Moon and Earth was taken 0.0125 quite like the real thing.
For the following explanations, I switched back to normal view of x-y plane and the fixed C.o.M system: The initial position of the satellite is given by its radius (measured in Earth-Moon distances from the centre-of-mass) and the angle (0 degrees is the direction towards the Earth, 180 degrees towards the Moon).
The initial velocity is given as the tangential and the radial components - again as seen from the centre-of-mass. The unit velocity is the circular velocity for an orbit with a unit radius, i.e. the distance Moon-Earth. All looks a bit complicated, but a couple of tries will give you a feeling what you are doing. If you hit the Enter or Return key of your keyboard after changing a number in the entry fields, the new initial situation is shown.
At the bottom one may influence the accuracy of the simulation, with a small value being more accurate but also more slow. You may not need this except for tricky orbits or just to check whether your last result is accurate enough or still contains effects due to numerical errors. Keep in mind that these simulations are never exact.
Altering the initial values as in the screen below:
Go back to the Operate page and launch the satellite
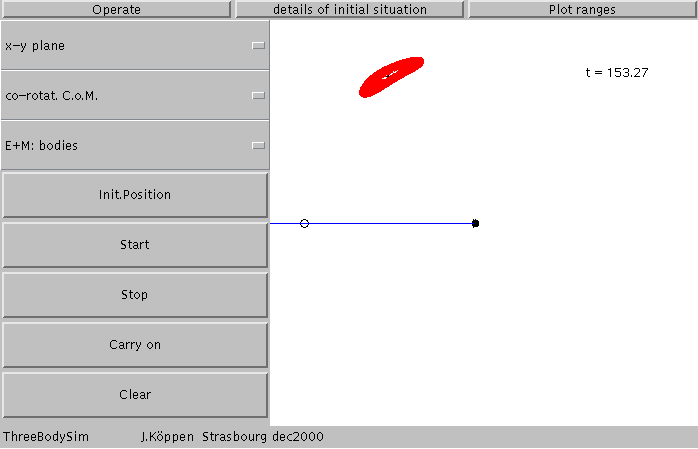
well, it looks more messy than impressive or informative. We've launched the space probe in a circular orbit like that of the moon.... But let us look at the same simulation not from any of the fixed systems, but as if we stood in the Centre of Mass and kept our eyes always fixed on the moon:
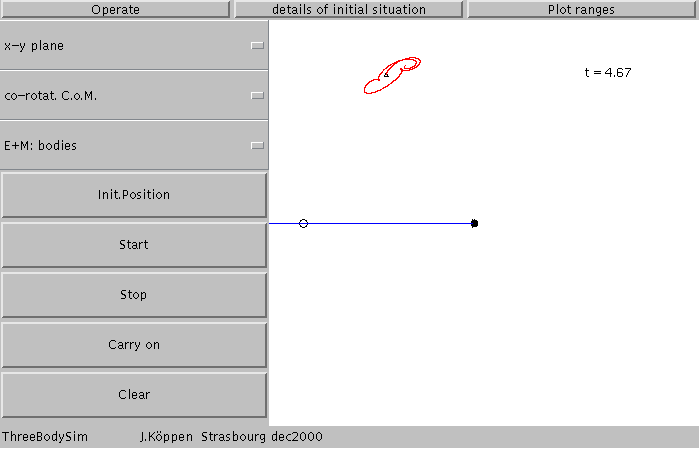
The space probe keeps rather close to a position about 60 degrees behind the moon! This is one of the five Lagrangian points, it is L5. The craft will stay there a very long time, and only move around a bit in what is called libration:
Could we place the spacecraft exactly in the centre of this libration area, to make it stay there? Let's try by clicking first the button marked Init.Position which wipes the screen to show only the initial position. If you move the cursor over the screen, you'll notice it has changed into a cross. Place it wherever you want, click the mouse button, and the new position along with the initial velocity vector shows up. Start the simulation and find out whether you're happy with the orbit. Of course we have not changed the velocity - this has to be done by changing the respective entry fields. But have a look what I've got by moving the insertion position all over to the side opposite the moon whose mass I've also made 10 times smaller:
This is called a Horseshoe orbit. It starts from Lagrangian point L3, drifting slowly towards L4, going around it, returning to L3 and passing over to L5, etc. When the moon's mass is very small, L3 is exactly opposite the moon. To finish off with these points, L2 lies 'behind' the moon and depending on the mass ratio quite close to the moon. L1 lies between the Earth and the Moon, near to the point where the gravitational pulls from Earth and Moon balance each other; it is not a stable place to put a spacecraft like in L4 and L5, but one can keep it there for a long time if one makes small corrective maneuvers to prevent it from drifting away. Such a technique can also be used for L1 and L3.
But let us go back to the libration about L4 or L5. Can we have a closer look at these loops? Yes, there are two ways: The easiest way is to click the drag & Zoom button and drag the mouse (with pressed button) across the area which you want to blow up. Then start the simulation again. Preferably drag from upper left towards the lower right; otherwise the zoomed picture may have a changed orientation.
You can always go back to the normal values for the screen limits by clicking the unZoom button.
The second way is via the Plot ranges page
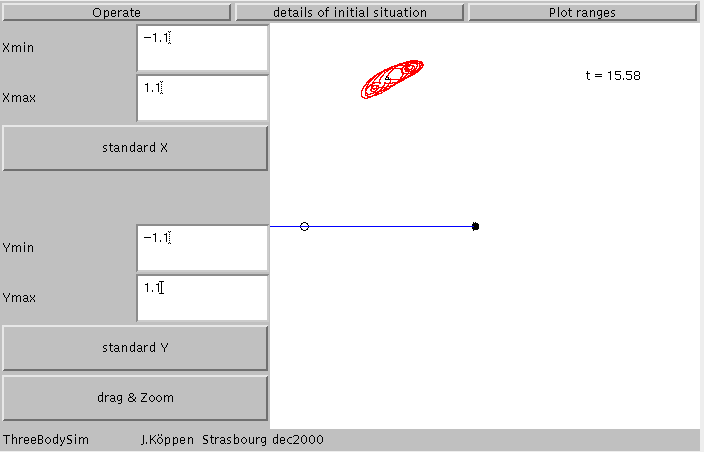
which tells us the details of the screen covering -1.1 to +1.1 in both x- and y-directions. You can enter any values for these coordinate ranges. If you hit the Enter or Return key on your keyboard, the new view will be shown. In our example, we may want to show only at the upper left hand section, so we limit x between 0 and -1.1 and y between 0 and 1.1. Go back to Operate and Start the simulation:
You notice that there is also a Drag & Zoom button on this page. Going back to the normal values for the screen limits is done by clicking the buttons standard X on the Plot ranges page.
And here I've searched for the insertion point giving a very small libration
Suppose we want to get to the Moon. Of course with as little effort as possible, i.e. the initial velocity should be just sufficient to make the transfer from some Earth orbit to the Moon. I've started with a parking orbit of about 38000 km radius - which happens to be nearly the geostationary orbit. Note that for such orbit the circular speed is 3.16 (as the speed goes like the inverse square root of the radius of the orbit). I'll start at angle 0 degrees with an initial speed of 4 which is larger than the circular speed, of course:

I get a nice rosette orbit, but still far to close to the Earth. So let's increase the speed to 4.4:
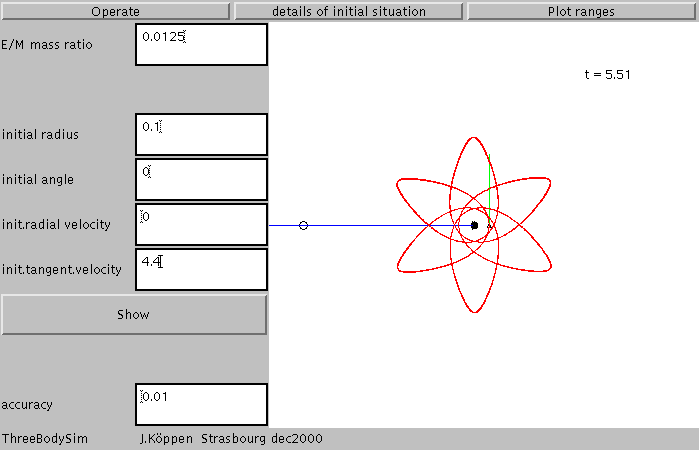
which is a wonderful, stable rosette with 6 leaves, but utterly insufficient for our aim.
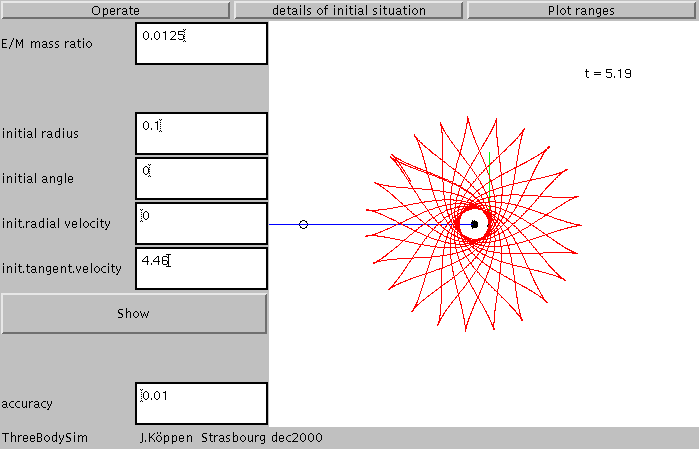
With 4.46 we've got another wonderful shape. Here the tangential motion at apogee has become nearly equal to the Moon's speed, so the Moon is able just to overtake the spacecraft. With a still higher speed of 4.5
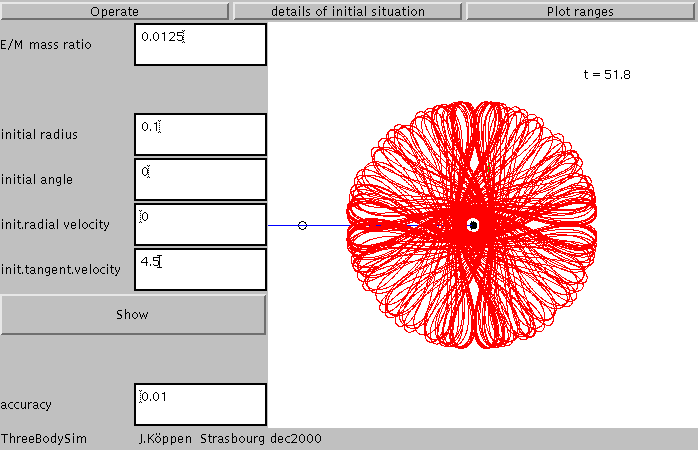
the apogee reaches far enough so that in its apparent motion the Moon can overtake the spaceprobe, thus creating the round petal shapes. But we still remain a satellite of the Earth!
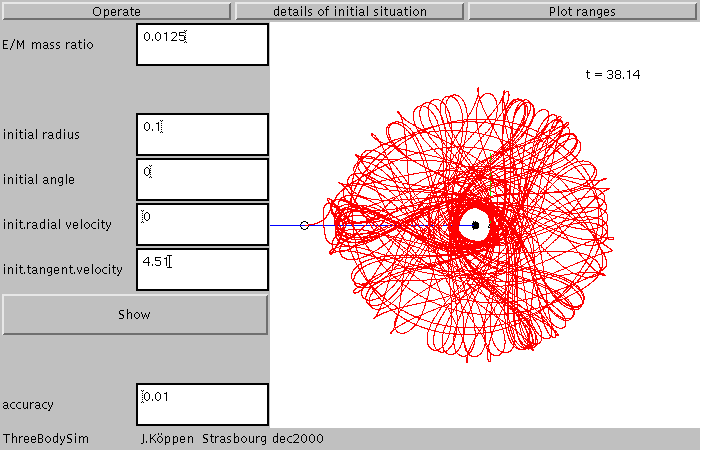
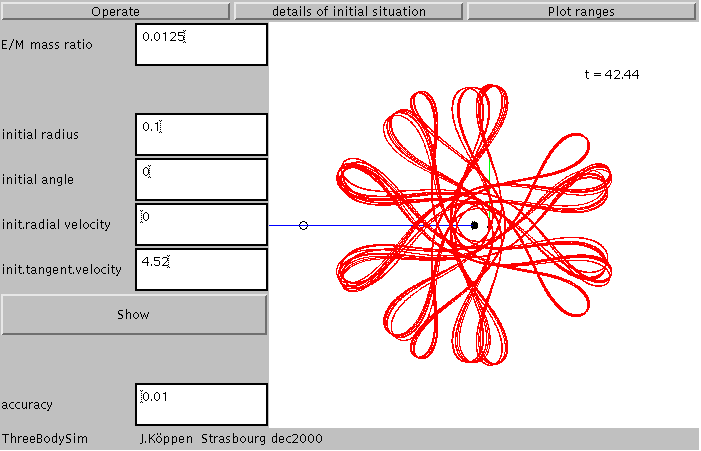
And now, with a wee bit higher speed of 4.51, we get a chaotic orbit which brings us to the Moon in about 38 months, more than three years.
It is very nice to watch how the satellite passes slowly through the vicinity of L3 as if it had to decide whether to go back towards Earth or towards the Moon, and how it switches between different orbit shapes.
But we should be a bit careful believing our result fully, because some of the chaos may be caused by finite accuracy of our simulation. If we wanted to be more sure, we'd have to make a more accurate run which will take more time!
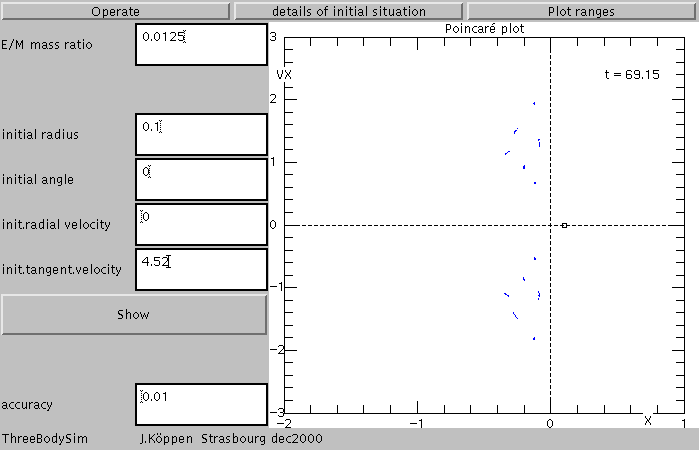
The best way to study complex orbits is to use the Poincaré or Surface-of-Section plots, as they present the information from many orbits in a very compact form. For more explanations .
We shall watch the passages of the satellite through the plane, shown as the blue line connecting Earth and Moon, whenever it goes upwards. Each of these passages is marked in the Poincaré plots as a point, as in this plot from the last model
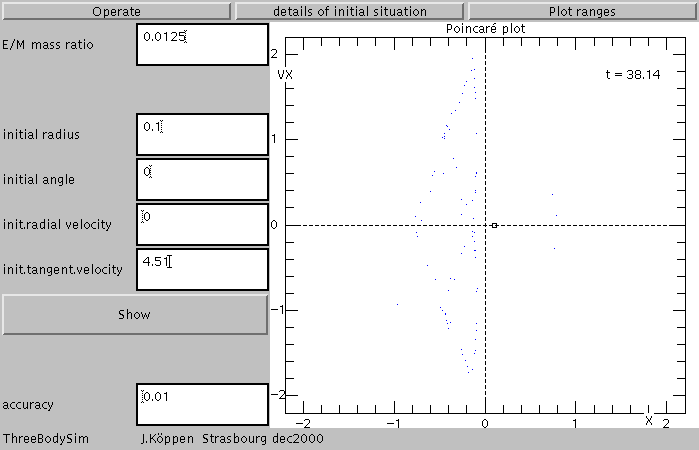
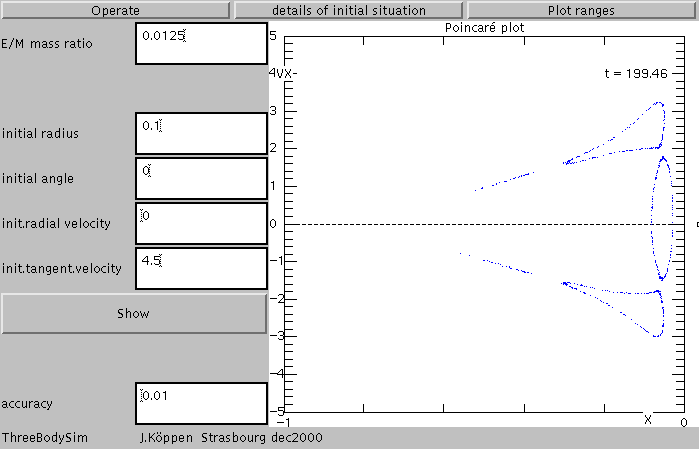
But let us go back to the simpler model with an initial speed of 4.5. This shows that the rather wild bunch of petals
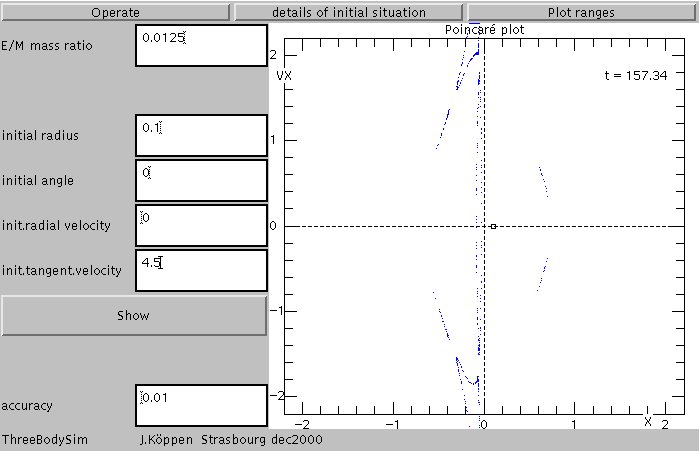
has some rather neat structures. Zooming in and applying some more patience, reveals only narrow curves. So there is no chaos in this orbit
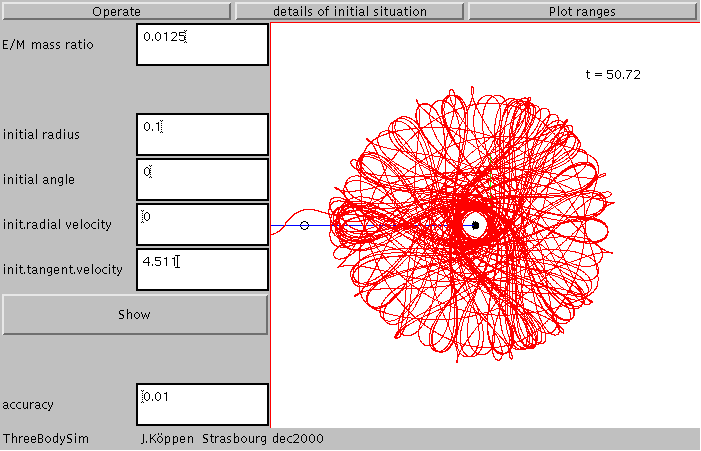
Now we take a model with an even larger initial speed, 5.2. We find that it never seems to reach the Moon, though from its larger energy one could expact that. The orbit
turns out to be a rather complicated pattern with a strict symmetry and which remains stable for a very long time. Its Poincaré plot shows this regular structure very clearly.
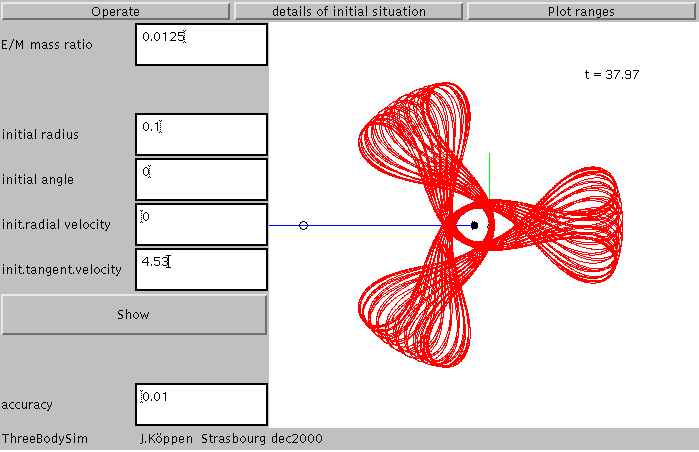
And here is a model with even higher speed of 5.3. It has a nice regular orbit with three petals:
With a speed of 5.11 we can observe several switchings of the orbit shape, before the spaceprobe gets thrown outside the lunar orbit:
and this is what it does there: apparently it always gets a kick from Moon or Earth and thus picks up more and more energy which drives it further and further out into space!
Though we do not want to overinterprete our little simulation, but what it shows is an enormous variety of types of orbits all possible from a rather small interval of initial velocities. Just a small change in the insertion velocity or any other initial parameter causes the character of the orbit - especially as far as the long term behaviour is concerned - to change drastically.
To show something else than the Earth-Moon system, here is the orbit of a satellite among a pair of stars with equal masses. This is fun to watch with the fixed C.o.M system showing how the satellite first dances about one star, then changes over to the other, and so on
Hitting Return or Enter after changing any of the numbers will show the resulting initial position and velocity.
Hitting Return or Enter after changing any of the numbers will show the initial position and velocity in the resulting view.
About the method: the simulation uses a fourth order symplectic method which is a Runge-Kutta method modified as to conserve exactly angular momentum. The time step is automatically adjusted in order to keep the error in the energy of the satellite sufficiently low. This accuracy is determined by the parameter Timestep.
| Top of the Page | Controls | Applet | Applet Index |