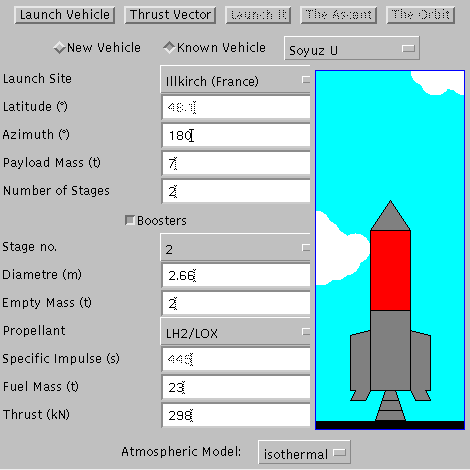
With the Launcher Applet one first selects in the Launch Vehicle page

the vehicle among a number of known vehicles (the launchers in parentheses have not yet their final data), the launch site, the azimut (0 degrees is North, 90 degrees is due East, ...), the mass of the payload, the number of stages (one can change a known vehicle by adding another stage, up to a total of 5). One can add or remove any booster stages. The technical data of any stage - which will be shown as red in the picture - can be inspected and altered: the diametre (which is required to compute the air resistance), the empty mass, the type of propellant (or the specific impulse, if you've selected "Others"), the mass of the fuel, and the total thrust of the stage.
After entering a number in one of the textfields, hit the return key to make it valid. There will be the message O.K. at the bottom of your browser's frame.
Finally, one may select the model for the atmosphere.
Then, one goes to the next page, to control the Thrust Vector
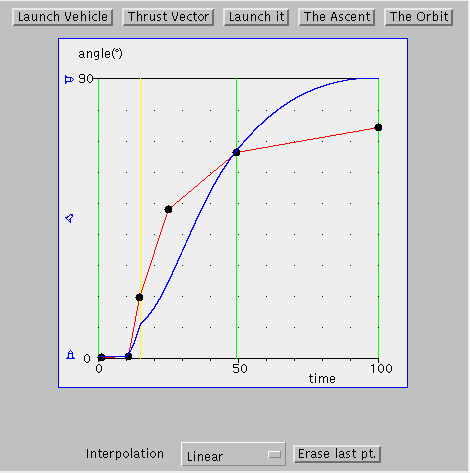
This shows, as a function of the time (in percent of the total powered flight) the angle of the thrust vector against the local vertical. The vertical green lines mark mark the burn intervals of the stages, the yellow one is the engine cut-off of the boosters.
Enter your flight profile by clicking with the mouse at suitable positions: At the beginning, the vehicle normally looks up vertically (angle = 0 degrees), thereafter you increas the angle until at cut-off time of the last stage you are flying nearly horizontally (angle = 90 degrees), if you try to launch into Earth orbit. For a high-altitude flight, you keep the angle close to zero all the time.
The proper thrust vector control is very important for every mission, and it needs to be changed if one changes the payload mass, the vehicle configuration, or the desired orbit. In this applet, we do this by specifying the angle of the thrust vector against the vertical. This is quite a simplification, as in real life the vector is changed either by moving the gimballed engines or by changing the vehicle's attitude by additional small thrusters.
If you click the Thrust Vector button again, the interpolating curve is shown which connects the entered points. You can grab a point and move it about. Also, you can freely add more points.
Once you see this red curve, the Launch it button is enabled, and you may launch the vehicle.
You have to wait a few seconds for the calculation to be done. After this, you will see a blue curve which is the actual orientation of the vehicle's longitudinal axis, measured against the local vertical. When and if this curve runs very close to the red curve, it means that one converts propulsion into kinetic energy very efficiently. This property had already been found out by Herrmann Oberth in the 1920s. To minimize the distances between red and blue curves serves as an indicator to find a good thrust vector control curve.
When you start completely afresh, it is a good strategy to first choose a control curve which is a straight line connecting the lower left with the upper right corner. By trial launchings you try to adjust your thrust vector curve so that it comes as close to the blue curve ..... Fortunately, launches with our applet cost next to nothing, are silent, and do not cause any pollution.
Now, I recommend to look at The Orbit page
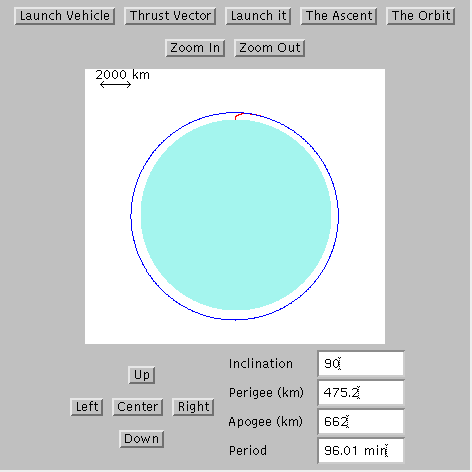
which gives an overview of the trajectory during powered flight (in red) and thereafter (blue), possibly an orbit around the Earth (light turquois). The view can be Zoomed In and Out, and shifted Up, Down, Left, and Right. In the upper left hand corner, the scale is indicated. For small scales, black points mark the grid in range and height.
Below, there is a table showing the inclination of the orbit against the Earth equator, the perigee and apogee (in km or Earth radii), and the orbital period (in minutes or hours), if the payload reached orbit.
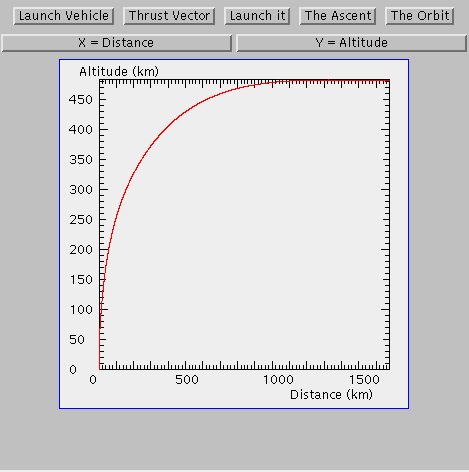
More details about the powered flight can be seen on on the page The Ascent which permits to plot any two of these quantities top be plotted against each other: Time, horizontal Distance, Altitude, Speed, Dynamic Pressure (when you get more than 170 kN/sq.m, we assume that the vehicle will break up), Acceleration, Mass (fraction of total mass), and Angle of vehicle against local vertical.
For example, this is the flight profile
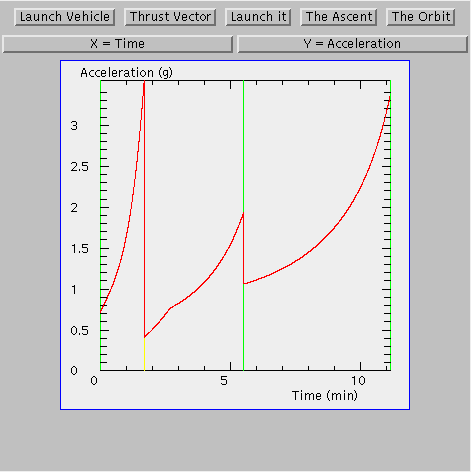
this is the acceleration as a function of time
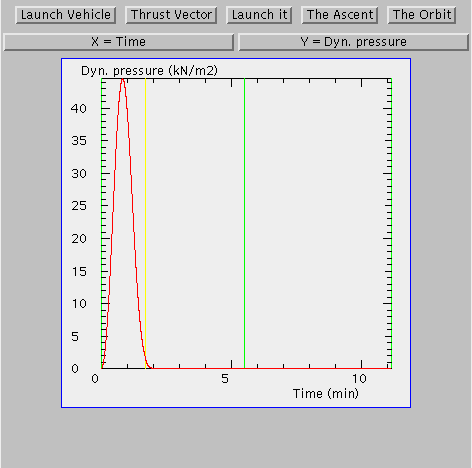
and this the dynamic pressure as a function of time
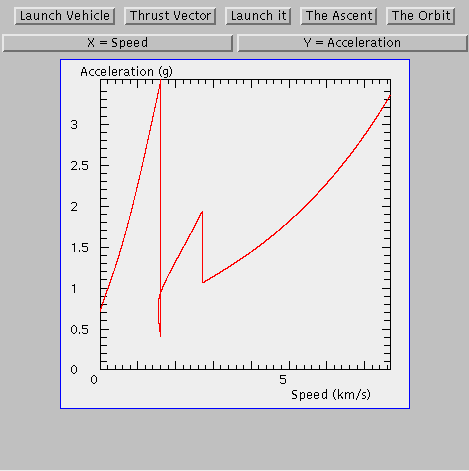
and here is acceleration as a function of speed, if you ever want to know this
| Top of the Page | The buttons | Applet | Applet Index |