Michelin Guide to the Solar System
Sarah Lawday, Jérémy Lebreton, Axel Richard, Florence Gris
Illkirch, april 2008

This page organizes all the computations of the departure and arrival windows. Therefore it is somewhat complex, and contains quite numerous options. We can :
|
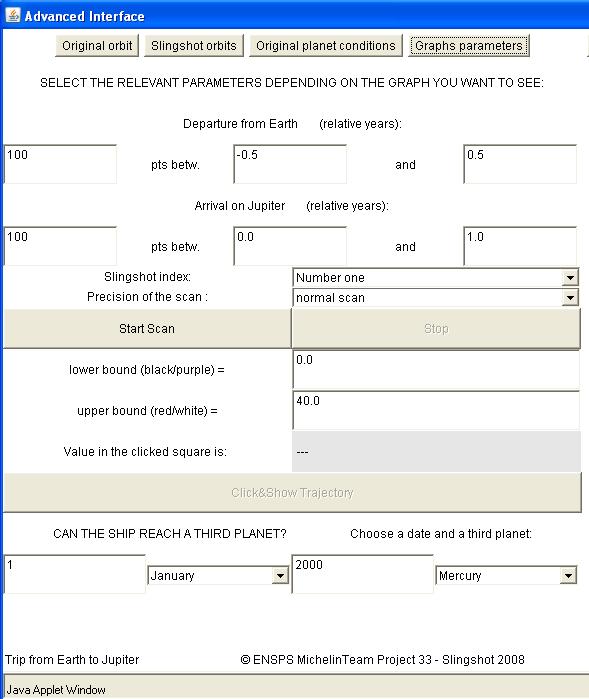 |
For the departure and the arrival you have to complete 3 boxes. In the first, you enter the number of points you want. In the second, you enter the year from which you want to make start your graph, knowing that 0.0 corresponds to the departure year of your travel. In the third, you enter the year until which you want to display the graph, in function of the start year. |
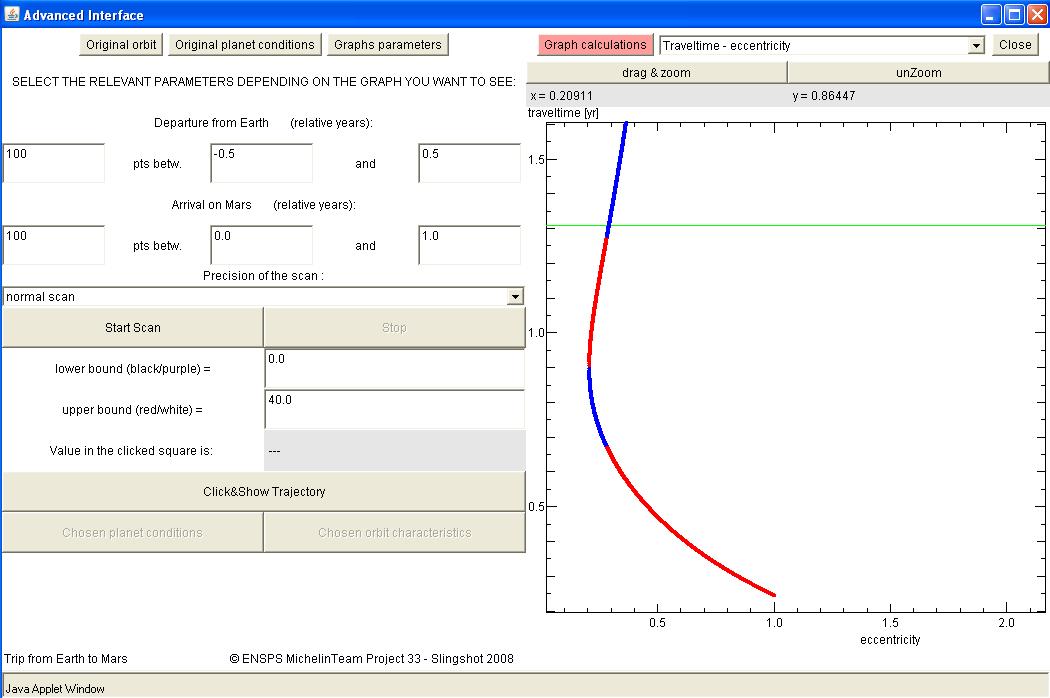
The plots in 2D You have access, thanks to the drop-down menu at the right top corner of the page, to many graphs in two dimensions. The first dimension is the time and the second is the parameter whose evolution we want to observe. |
|
| You have the choice between the following graphs: - The radius (the distance between the spacecraft and the sun) -The distance -The radial velocity -The proper motion -The transit times |
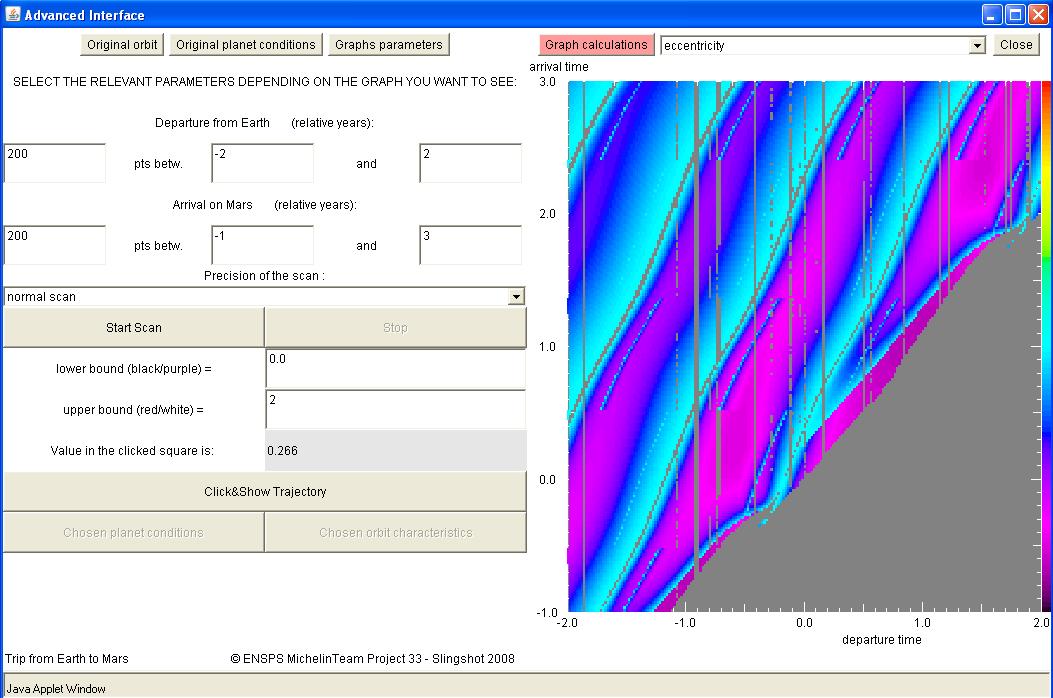
The plots in 3D 3 dimensional graphs display shall also be available. The third dimension is given by a coloured display, the X-axis shall be departure time, and the Y-axis the arrival time.
|
|||
 |
|||
The purple areas indicate that there is a launch window where the value of the parameter displayed is low. On the contrary, if the color is near from red, it means that this value is high.
|
|||
You have the choice between the following graphs:
|
| The simple trip plots. |
| The slingshot trip plots. |
| Simple Tutorial. |
| Slingshot Tutorial. |