In addition to the optical observatories, other installations have been contructed to examine these other radiations. We shall be concentrating on the radio waves here.
Although there are many different types of radiotelescopes, one of the more common designs is that of the "big dish" - such as that at Parkes (NSW Austrlia) or Jodrell Bank (Cheshire, UK). The idea is that radio waves come in from space, are bounced off the surface of the dish and are focused onto a piece of electronic equipment - the receiver. This converts the radio wave into an electrical signal that can be measured.
These telescopes are huge - many tens of metres across, which raises the obvious question: why build them so big?
So to build more sensitive telescopes with better resolution, astronomers simply build bigger dishes - up to a certain limit. Due to structural limits, one can only build them so big (up to a hundred metres or so). Certainly dishes of, say, 5 kilometres are out of the question - especially if you want to be able to steer them around to point at different parts of the sky.
If you just have a row of telescopes, such as the Australia Telescope Compact Array, the result is a telescope with great resolution in one direction but poor resolution in the other. However, by waiting for 6 hours, the earth will have rotated the telescope with respect to the object in the sky to provide good resolution in the other direction.
By plotting the virtual tracks that the antennas trace out as the earth rotates, astronomers can gauge how good the telescope will be a resolving objects in the sky. This plot is referred to as the uv-coverage as the two axes are U and V (it has nothing to do with ultra-violet radiation!).
The uv-coverage is not a mask on the image itself, but is a mask on the fourier transform of the image. It shows where on the fourier plane the image has been sampled. It's a bit like putting the uv-coverage mask over the aperture of an optical telescope.
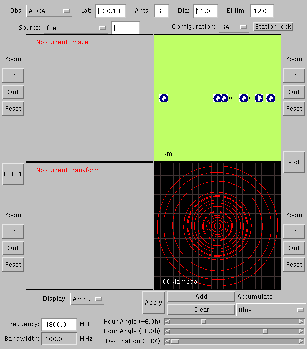
Start the applet (click on the image to start the applet):

At the top of the applet is a row of widgets that allow control of some of the observatory parameters. They are (from left to right): the observatory (a number of preset telescopes), the latitude of the observatory (negative latitudes are south of the equator), the number of antennas/elements, the diameter of each antenna (in metres) and the minimum elevation limit of the antennas (in degrees above the horizon).

For out tutorial, set the number of antennas to 3. By clicking on the Plot button, the resultant uv-coverage will be displayed in the lower right panel.
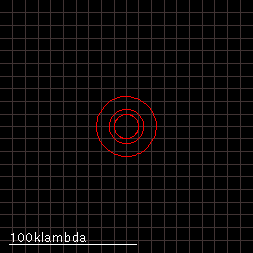

The white line in the uv-coverage plot shows the scale of the plot. Lambda is the greek letter used to denote wavelength. 100 klambda is therefore 100,000 wavelengths. If the wavelength is 10 millimetres, 100 klambda is 1 kilometre. This means that with the same antenna spacing, doubling the frequency of the observation doubles the resolution of the telescope. The down side is that higher frequency observations are harder to make (electronic, weather and other technical challenges), and at different frequencies, radio objects in the sky might look different in brightness and shape.
Using the mouse, try dragging the antennas about on the observatory layout map. After placing them, click again on the plot button.
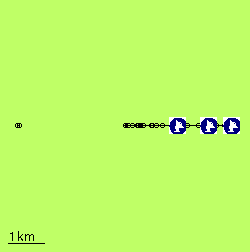
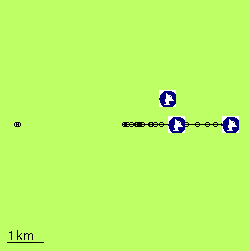
On the "antenna map", the bar at the bottom left shows the scale in kilometers. On all of the display panels, the zoom buttoms will allow you to look more closely at the graph, map or images.

Also, by placing the mouse cursor over one of the displays, the cursor keys can be used to scroll the image about. The PgUp and PgDn keys also zoom the display, to compliment the cursor control.
The uv-coverage is also affected by where the object is in the sky and for how long you observe it. VRI can simulate this with hour angle and declination control.
All objects in the sky will rise every day in the east and set in the west. During that time they will cross an imaginary line called the meridian, which runs from North to South, passing overhead. This line is also referred to as having an hour angle of zero. A full observation usually goes for 12 hours, 6 hours before and after the source crosses the meridian (i.e. transit). VRI can simulate the different amounts of observing time by altering the starting and finishing hour angle of the observation.


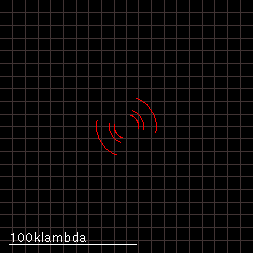

The declination (celestial latitude) of the radio source will also affect the resultant uv-coverage.


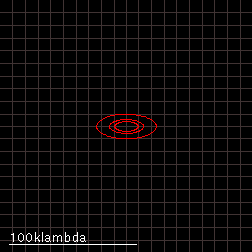

As you can see, a east-west row of antennas will have better coverage of a source near the celestial pole than it will of a source near the equator. Also, because of the minimum elevation limit of the antennas, it might not be possible to always observe for 6 hours either side of transit for sources near the equator. Some sources will only be about the horizon for a short period each day. Try dragging the declination slider further and further away from the pole and watch the hour angle sliders shrink in their range.

On selection, the image will appear in the top left display panel. The transform buttons FFT and FFT-1 (FFT is fast fourier transform) will convert the image to the transform and vice versa. Try doing this for different sources. The following is for a (simulated) radio galaxy. The amplitude of the transform is shown here.

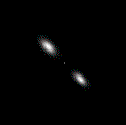
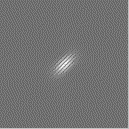
Fourier transforms are, in general, arrays of complex numbers; each pixel having both a phase and amplitude component. The different representations of the fourier plane can be selected in VRI.

Using the Apply button, you can blank out the portions of the uv-plane that were note sampled by the observation of the object.

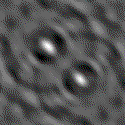
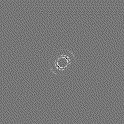
The image (left) indicates how the source would appear if observed with that particular antenna/time configuration. As you can see, with just 3 antennas, the image is not very good. To improve it, more antennas can be used, or the observation repeated with antennas in different locations. Some observatories have antennas that can be moved, this allows more complete uv-coverage of an object to be built-up over time. VRI allows you to select the different configurations of the ATCA et al..

You can simulate the addition of different configurations by clicking on the Add button after each observation is simulated. When the Apply button is clicked, all the accumulated observations will be
nm@jb.man.ac.uk).
Return to the NRAL - Jodrell Bank Home page
Return to the Merlin Home Page
Original: dmckay@atnf.csiro.au (7-MAY-1997)