Observing TV satellites
Joachim Köppen Strasbourg 2007
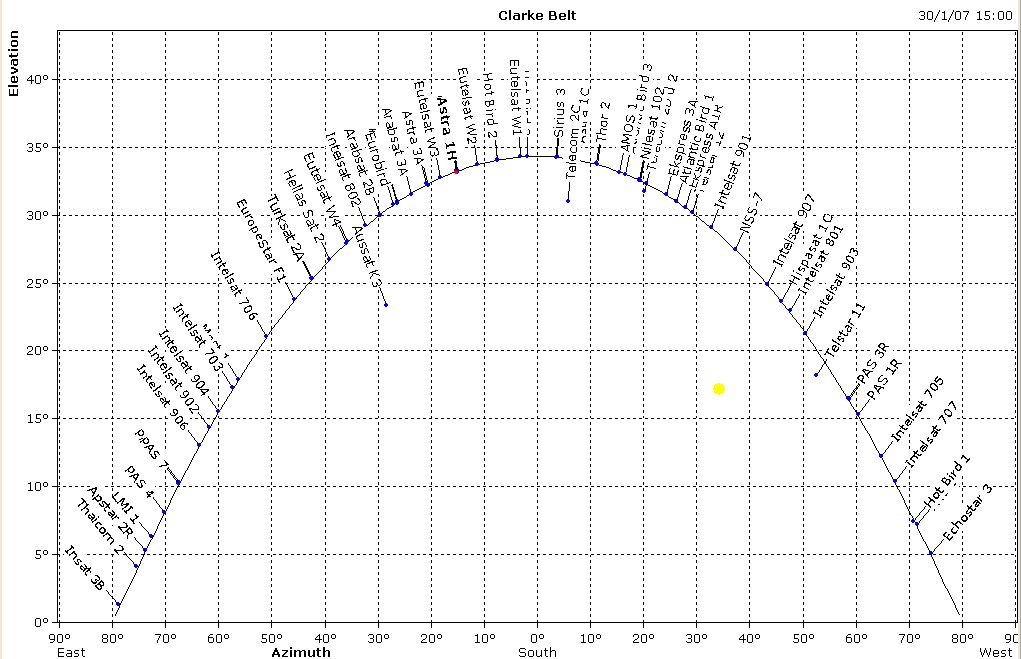
The Clarke belt:

A software to predict the positions of the satellites, the Sun, and the Moon is GorbTrack.
The formulae to compute the positions of TV satellites can be found e.g. in a text by Mauro Bertolini: Let the observer be at geographical longitude L and latitude B, the geostationaty satellite shall be over the equator at longitude S, then first compute the longitude difference DL:
Marc Cornwall undertook a systematic mapping of the sky at 12 GHz. In a coarse survey, done on Valentine's Day 2007, he captured a few strong satellites, by moving the telescope in slow motion across the azimuth range from 90 to 270° for a constant elevation angle, and then repeating this procedure for all elevations from 0 to about 40°. With less than 2 hours of observation he obtained most promising results:
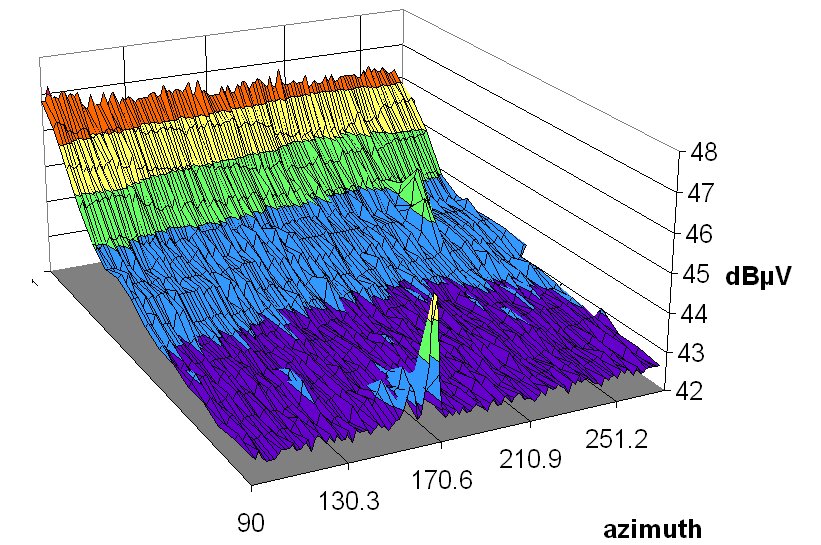
This rough Valentine Survey showed that the background depends on the elevation angle, which permits us to analyze and separate the sky and receiver backgrounds. However, the time spent by the telescope at each position was a bit too short to catch many satellites, so he embarked on a much more ambitious project, by stepping in elevation upwards, taking about 100 data samples at each point, and doing this elevation scan for all the azimuths ... The results obtained until mid-march show indeed the satellites neatly arranged in the sky along the Clarke belt:
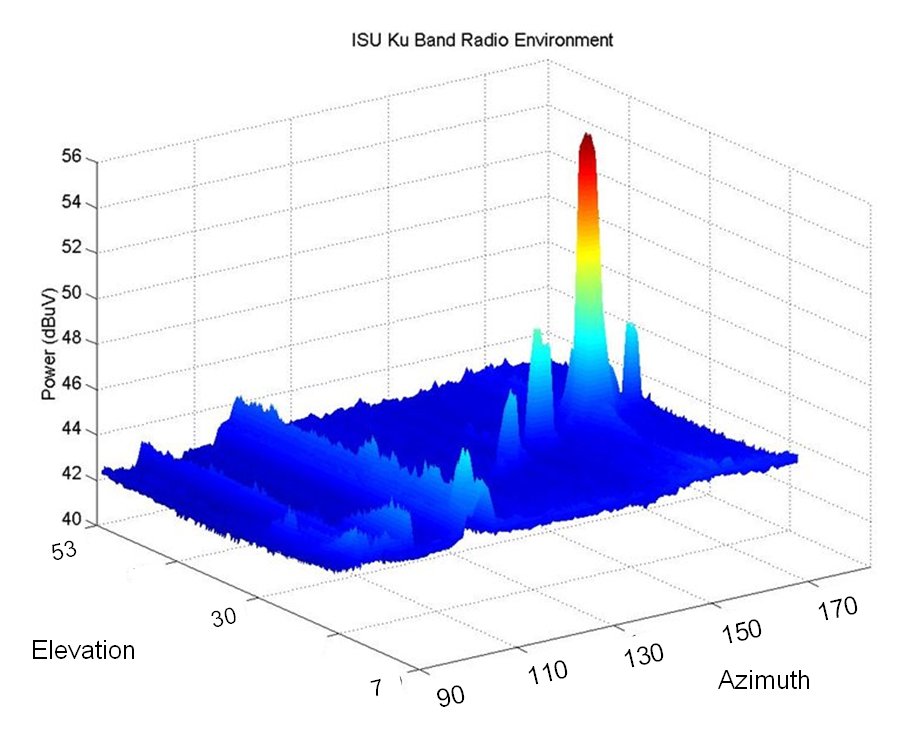
When completed, this unique data set will constitute about 150 hours of pure observation time ...
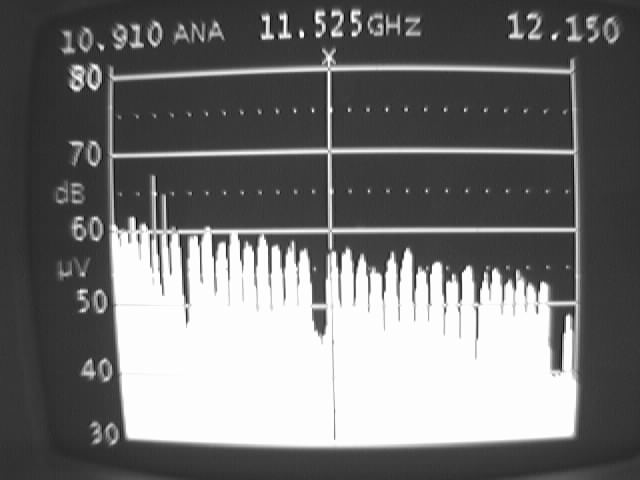
A screen shot of the spectrum analyser display showing the channels of the Astra 1H satellite.
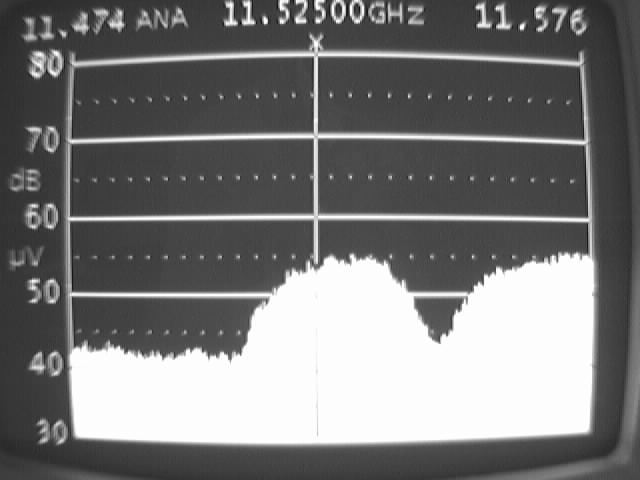
A narrow band view of one of the coded channels ...
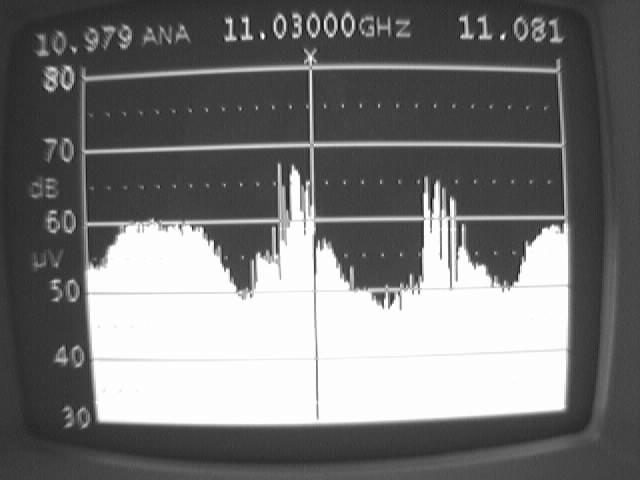
... and one of the open channels ...
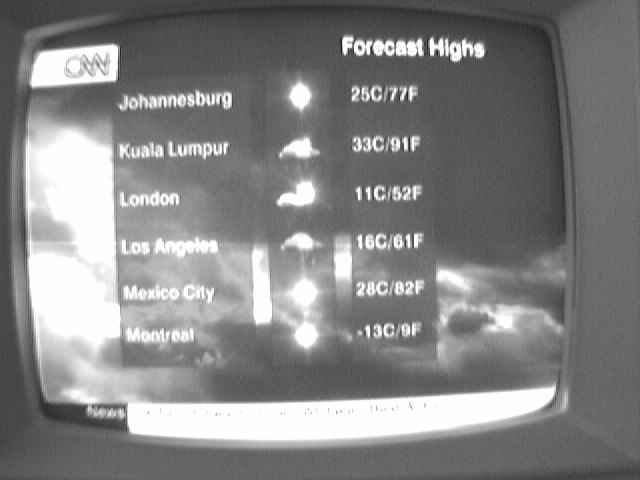
... which turns out to be CNN.
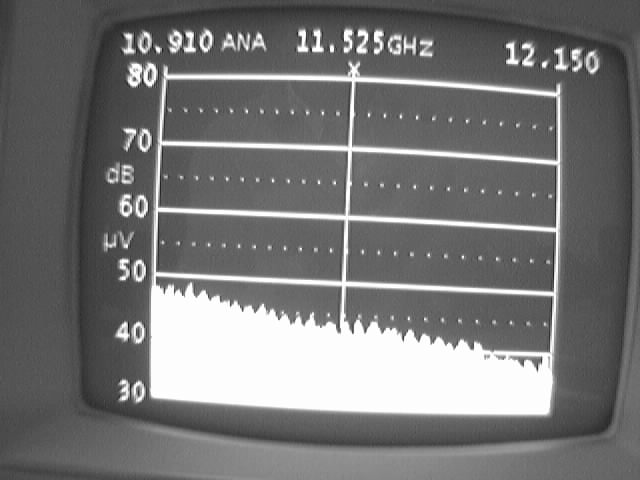
The spectrum of the empty sky. Note the small regular bumps which are probably due to standing waves from reflections in the cable from LNB and receiver, or mismatch between LNB and reflector dish.
How to measure the power emitted by a satellite:
With the flux calibration using the ground or a building which will have a temperature of about 300 K, we can convert the measured signal strength (or the antenna temperature) of a satellite into proper units. For example consider our first observations: We found that the Astra 1H satellite - if we tuned into one of the coded channels - gives about +47dBuV, about the same as the calibration on the Holiday Inn building. Thus we can say that the antenna temperature of the satellite is about 300 K; its signal has a power density of kT = 1.38E-23 * 300 = 4 E-21 W/Hz or 400000 Jy m².
At that time, our antenna dish had been out of focus, with a HPBW of 3.75 deg instead of 1.3 deg; hence, the effective area of the dish was not the 0.84 m² of the prototype, but about 8 times smaller: 0.11 m². This gives a flux density for the satellite of F = power/area = 4E-21 / 0.1 = 4E-20 W/Hz/m² = 4 MJy.
From the flux we can compute the effective isotropic radiated power (EIRP) of the satellite: EIRP = 4 pi distance² * F * BW if we know the distance = 38000 km and also the bandwidth BW of the transmitter. The satellite's transmission is the sum of all transponders (let us assume about 50: twice 25 as seen on the scren shot above, since each channel is used both in vertical and horizontal polarization) which emit one TV channel of bandwidth of about 5 MHz, so that the total bandwidth is about 250 MHz.
These values give an EIRP of 170 kW or +52dBW. This agrees very well with the value of +51 dBW from the technical information on the Astra 1H satellite.
A look behind the formulae:
To compute the received power P_rec from the transmitter power P_trans one uses Friis' transmission equation:
Since the antenna gain is related to the effective area by
Thus, the link budget goes like this:
| linear | dB | |
| transmitter EIRP | 160 kW | +52 dBW |
| free-space loss | 3.1 E-21 | -205 dB |
| before antenna repair | ||
| antenna eff.area | 0.1 m² | |
| antenna gain | 2000 | +33 dBi |
| received power | 1pW | -120 dBW |
| antenna temperature | 300K | 0 dBT0 |
| after antenna repair | ||
| antenna eff.area | 0.84 m² | |
| antenna gain | 16000 | +42 dBi |
| received power | 8pW | -111 dBW |
| antenna temperature | 2400K | 9 dBT0 |
| ------- | ||
| thermal noise (300 K) | 4.14 E-21 W/Hz | -204 dBW/Hz |
| thermal noise (BW 250 MHz) | 1.04 pW | -120 dBW |
| Top of the Page | Back to the MainPage | to my HomePage |
last update: 27 Mar. 2008 J.Köppen