Galaxies falling into a cluster: Examples
Joachim Köppen Kiel July 2017
Some brief explanations
This Monte Carlo simulation shows the properties of galaxies which are falling radially but from all directions to the centre of a spherically symmetric cluster of galaxies. While they follow this path, the ram pressure by the hot intracluster medium (ICM) removes some of the interstellar gas of the galaxy. Since this pressure increases with diminishing distance from the centre, the gas loss also increases. This can be studied for galaxies of a single type, but also for a population of galaxies with different properties. The simulation does not follow the actual flight of a galaxy, the spatial distribution of galaxies does represent the snapshot computed for a certain instant; instead, one chooses a radial profile for this distribution. The user may show the various quantities of the cluster and the galaxies as plots, histograms or false colour maps.One important feature of the simulation is that it shows the difference between the quantities in the true 3-D space of the cluster environment and the galaxies' trajectories and their relation to parameters that can be measured by an observer from the outside, such as the position in a 2-D image and the radial velocity.
As the simulation is fairly complex, has many options, and needs various parameters, here are some examples to show how to use this tool:
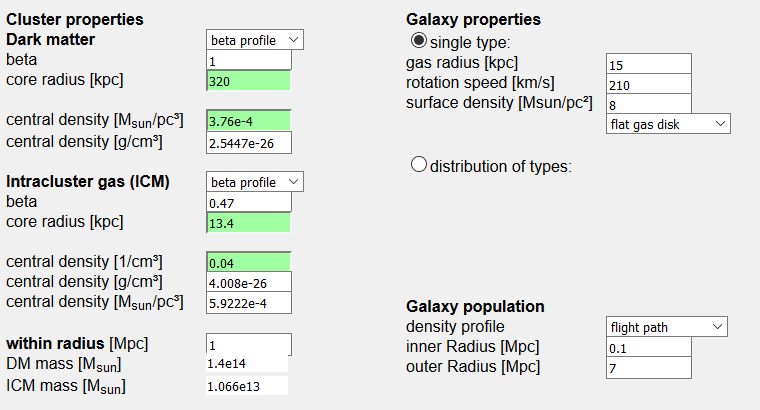
Let us first use the default model for the cluster, representing the Virgo cluster and let us use galaxies of the same type (similar to the Milky Way). Then we chose for the population of the galaxies the option flight path which means that they are more densely distributed in space where their velocity is smaller, thus where they spend more time:
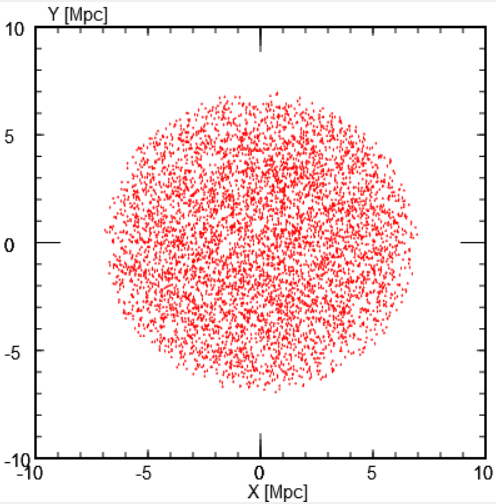
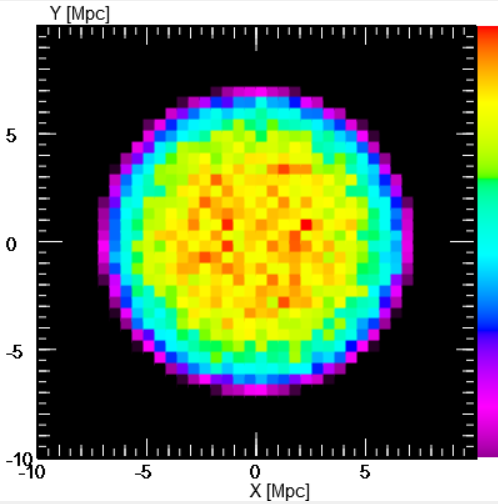
Left: A fly-dirt plot of the X and Y positions of about 6000 galaxies shows how the cluster would look like to an observer. The false colour map (Right) of the same model, but with 100000 galaxies to give a smooth map, shows also that the galaxies are distributed almost evenly over the image of the cluster, with the density dropping slightly near the rim.
 |
 |
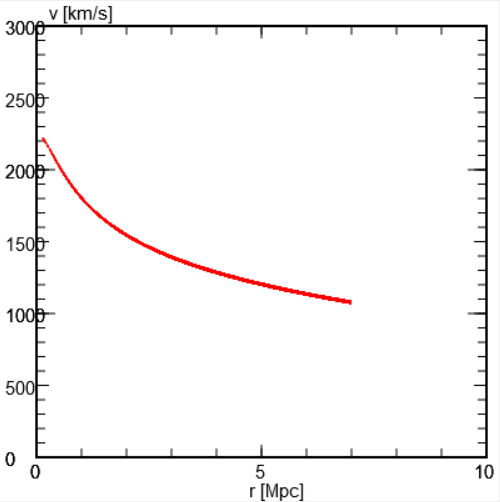
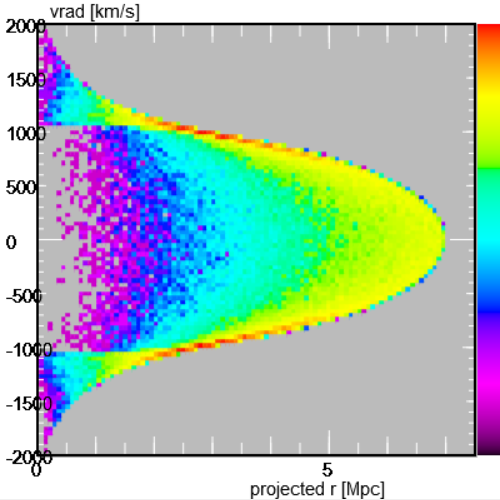
The plot on the left shows that the escape velocity from the cluster decreases with the true radial distance of a galaxy from the cluster centre. In the simulation, the galaxies fall in radially towards the cluster centre, with a speed with is close to the local escape speed. An external observer can only measure the radial velocity as a function of the projected distance from the cluster centre. A fly-dirt plot quickly saturates, thus a false colour map shows the details better: Close to the outer rim, there is a strong concentration of objects at zero velocity from the many galaxies which fly tangentially to the line-of-sight. Galaxies near the centre tend to have high radial velocities. The map with logarithmic scaling - and using the Zoom option for both axes - allows to see that the upper and lower envelopes for the pixels are formed by a curve similar to the relation of escape velocity vs. distance from the centre.
 |
 |
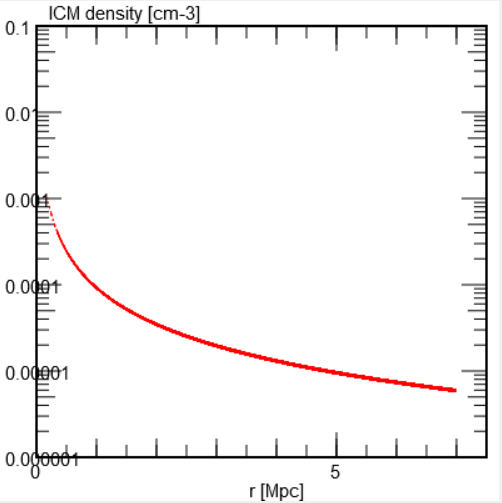
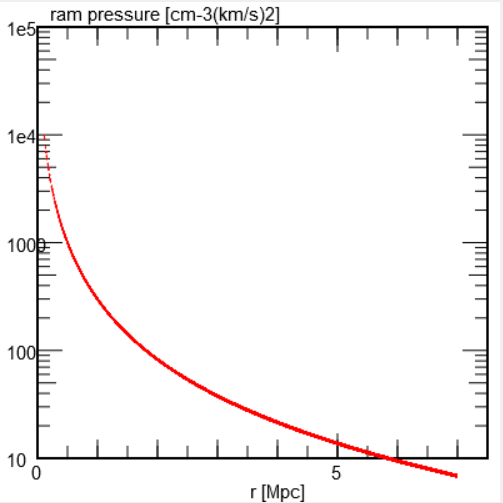
The parameters for the cluster describe the distribution of dark matter, which determines the radial dependence of the escape velocity, and the spatial distribution of the hot ICM. The radial profile of the ICM density is shown ine the plot at left. The ram pressure that a galaxy experiences during its flight through the cluster depends on both ICM density and the galaxy's speed. As both rise towards the cluster centre, the ram pressure peaks at the centre very sharply, as shown on the plot on the right. Because of the high speed, a galaxy does not stay long near the centre, thus one does not find many objects here.
 |
 |
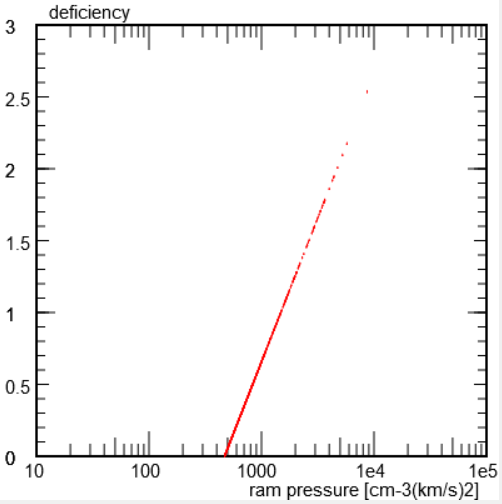
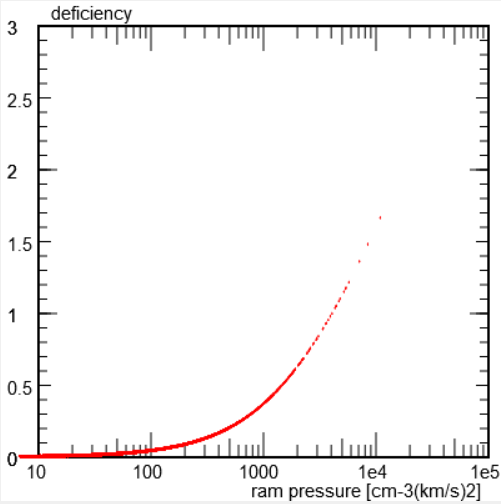
Depending on its model parameters, such as rotational speed and (initial) gas mass, there exists for a galaxy a relation between ram pressure and gas deficiency (which is defined as log10(Minitial/Mpresent) from the initial and present gas masses: The left plot shows the relation for a disk with constant sufrace density, the right hand plot is the more "relatistic" relation, as from a disk with an exponential profile.
 |
 |
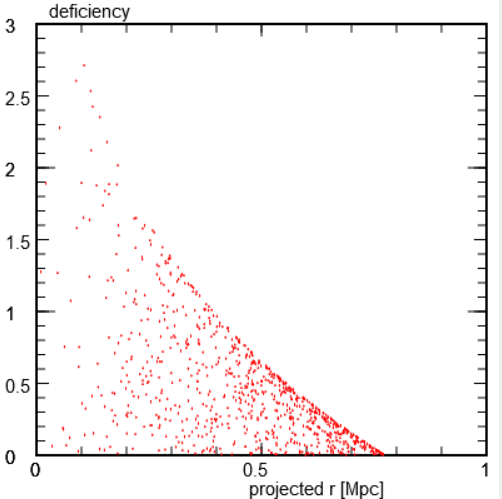
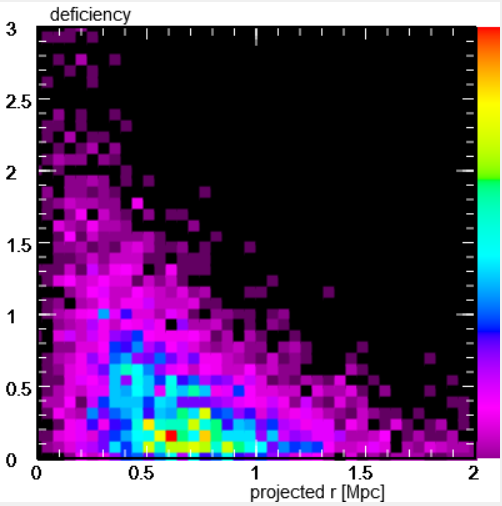
As ram pressure is highest close to the centre, galaxies with high deficiencies are found at small distances from the centre. An external observer would notice this also from the relation with the projected distance from the centre (left plot, done with 1 million galaxies, and right map):
 |
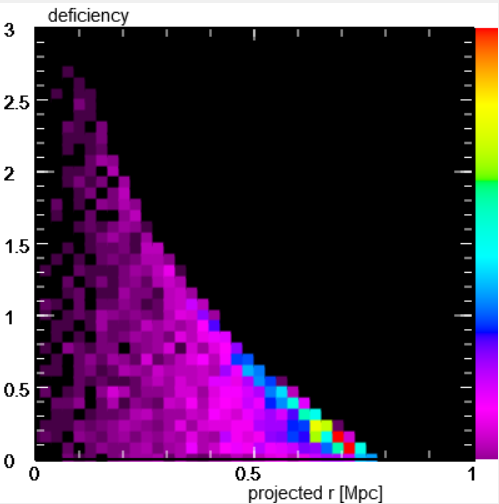 |
Since the time a galaxy spends near the cluster centre is rather short, only a small number of objects are found with high deficiencies. One also notes that the upper envelope of the dots and the bright pixels form a curve, which is nothing but the underlying dependence of deficiency on real distance from the centre. That most galaxies lie on or near that curve. This indicates that despite the projection of the spherical cloud of objects onto the 2-D image, one could recover the radius-deficiency relation from observations, if they are sufficiently numerous.
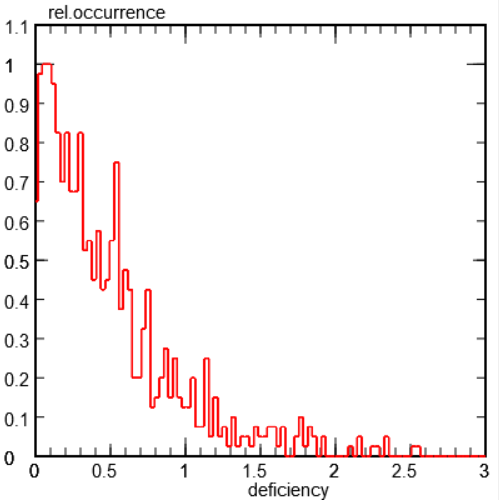
The paucity of high deficiencies can also be displayed as a histogram of deficiencies. A deficiency of 1.0 means that 90% of the initial gas has been lost, and 2.0 indicates that 99% of the gas is removed. Non-deficient galaxies are not counted in both this histogram and the above plot and map.
The above example pertains to all galaxies being of the same type. The tool can also simulate what is observable for a population of galaxies with different masses or optical radii:
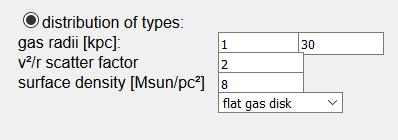
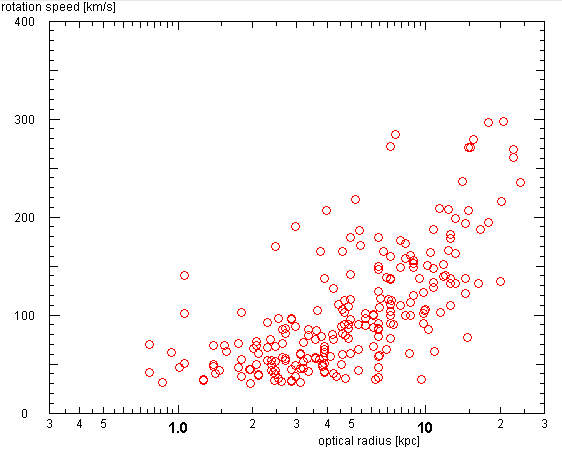
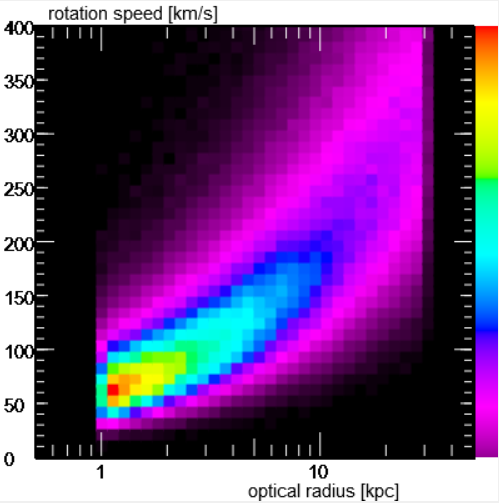
Here we suppose that objects can have optical radii between 1 and 30 kpc, and that the radii are logarithmically distributed. The gas disks are assumed to have constant surface density (as indicated). Observational data from the GoldMine data base (plot at left) suggests that one may take for the centrifugal acceleration v²rot/r at the outer rim a value of 4000 (km/s)²/kpc, adding a gaussian scatter with a factor 2 in either direction. The map at right shows that the relation between optical radius and rotational velocity is satisfactorily reproduced.
 |
 |
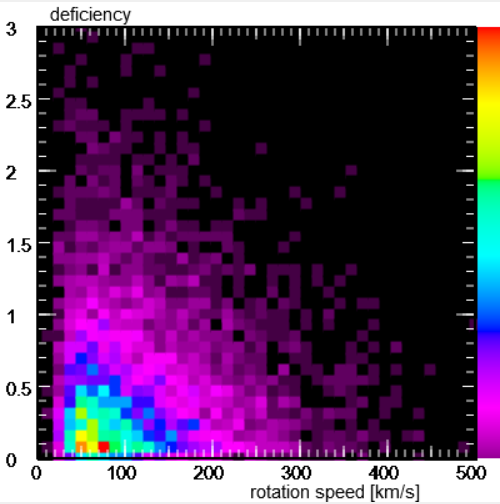
Using the same model for the Virgo cluster and the same radial infall of the galaxies, one now can create plot and maps of how observable quantities - as the deficiency - correlate with cluster or galaxy parameters: The left map shows because of the numerous dwarf galaxies (low rotation speed) there are more deficienct objects and they tend to be more strongly deficient. The right map shows that there is a large number of of lightly stripped galaxies at moderate distances (0.7 Mpc) from the centre. The upper evelope of the bright pixels still shows the distance-deficiency relation, but this is now the composite of the relations for each galaxy type.
The maps below were done with 5 million objects, many more than could be observed in a real cluster, but with them one obtains the theoretical distributions and perhaps an impression of the meaning of the real data.
 |
 |