streamplot.DomainMap Class Reference
Inheritance diagram for streamplot.DomainMap:
Collaboration diagram for streamplot.DomainMap:

Public Member Functions | |
| def | __init__ (self, grid, mask) |
| def | grid2mask (self, xi, yi) |
| def | mask2grid (self, xm, ym) |
| def | data2grid (self, xd, yd) |
| def | start_trajectory (self, xg, yg) |
| def | reset_start_point (self, xg, yg) |
| def | update_trajectory (self, xg, yg) |
| def | undo_trajectory (self) |
Public Attributes | |
| grid | |
| mask | |
| x_grid2mask | |
| y_grid2mask | |
| x_mask2grid | |
| y_mask2grid | |
| x_data2grid | |
| y_data2grid | |
Detailed Description
Map representing different coordinate systems.

Coordinate definitions:

* axes-coordinates goes from 0 to 1 in the domain.
* data-coordinates are specified by the input x-y coordinates.
* grid-coordinates goes from 0 to N and 0 to M for an N x M grid,
  where N and M match the shape of the input data.
* mask-coordinates goes from 0 to N and 0 to M for an N x M mask,
  where N and M are user-specified to control the density of streamlines.

This class also has methods for adding trajectories to the StreamMask.
Before adding a trajectory, run `start_trajectory` to keep track of regions
crossed by a given trajectory. Later, if you decide the trajectory is bad
(e.g., if the trajectory is very short) just call `undo_trajectory`.
Definition at line 233 of file streamplot.py.
Constructor & Destructor Documentation
◆ __init__()
| def streamplot.DomainMap.__init__ | ( | self, | |
| grid, | |||
| mask | |||
| ) |
Definition at line 251 of file streamplot.py.
Member Function Documentation
◆ data2grid()
| def streamplot.DomainMap.data2grid | ( | self, | |
| xd, | |||
| yd | |||
| ) |
Definition at line 272 of file streamplot.py.
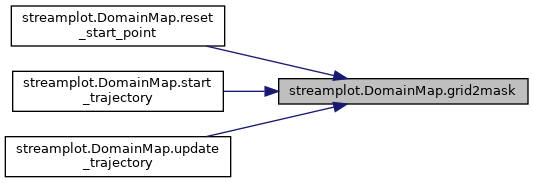
◆ grid2mask()
| def streamplot.DomainMap.grid2mask | ( | self, | |
| xi, | |||
| yi | |||
| ) |
Return nearest space in mask-coords from given grid-coords.
Definition at line 264 of file streamplot.py.
Here is the caller graph for this function:
◆ mask2grid()
| def streamplot.DomainMap.mask2grid | ( | self, | |
| xm, | |||
| ym | |||
| ) |
Definition at line 269 of file streamplot.py.
◆ reset_start_point()
| def streamplot.DomainMap.reset_start_point | ( | self, | |
| xg, | |||
| yg | |||
| ) |

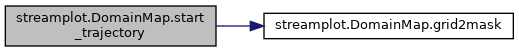
◆ start_trajectory()
| def streamplot.DomainMap.start_trajectory | ( | self, | |
| xg, | |||
| yg | |||
| ) |
◆ undo_trajectory()
| def streamplot.DomainMap.undo_trajectory | ( | self | ) |
Definition at line 289 of file streamplot.py.
◆ update_trajectory()
| def streamplot.DomainMap.update_trajectory | ( | self, | |
| xg, | |||
| yg | |||
| ) |

Member Data Documentation
◆ grid
| streamplot.DomainMap.grid |
Definition at line 252 of file streamplot.py.
◆ mask
| streamplot.DomainMap.mask |
Definition at line 253 of file streamplot.py.
◆ x_data2grid
| streamplot.DomainMap.x_data2grid |
Definition at line 261 of file streamplot.py.
◆ x_grid2mask
| streamplot.DomainMap.x_grid2mask |
Definition at line 255 of file streamplot.py.
◆ x_mask2grid
| streamplot.DomainMap.x_mask2grid |
Definition at line 258 of file streamplot.py.
◆ y_data2grid
| streamplot.DomainMap.y_data2grid |
Definition at line 262 of file streamplot.py.
◆ y_grid2mask
| streamplot.DomainMap.y_grid2mask |
Definition at line 256 of file streamplot.py.
◆ y_mask2grid
| streamplot.DomainMap.y_mask2grid |
Definition at line 259 of file streamplot.py.
The documentation for this class was generated from the following file:
- /home/webadmin/src/fosite/src/tools/plot/streamplot.py