Observations of the Sun are quite important, not only because of the Sun, but also
to measure important parameters of the telescope itself. At the frequency of 11 GHz
the Sun emits a continuum radiation produced by the hot gas which makes up the Sun.
However, at radio frequencies the emission does not come from the photosphere that
we observe in the visible wavelength range, but from the hotter layers above the
photosphere: at 11 GHz we look at the bottom of the Transition Layer between
the Chromosphere and the Corona where the temperature starts to rise.
The other aspect is about the telescope: Since the empty sky provides radio wave
emission only at negligible intensity, the signal that we measure is essentially
the background noise from our receiver. Comparing the solar signal with that of the
sky we obtain a measure of the sensitivity of our instrument: The larger the ratio
of the solar and sky signals is, more sensitive is the system. We express this more
quantitatively as the System Temperature.
The third aspect is also technical: We can determine the width of the antenna pattern,
i.e. the Half-Power Beam Width (HPBW) which describes also the angular resolution
possible with the antenna. This is done by letting the Sun - which we use as a source
with a constant signal - pass through the antenna beam, and measure the time it takes.
With the knowledge of the Earth rotation's angular velocity we convert the time interval
into an angle, the HPBW.
Observational procedure
Important note: Because the positioning system of this telescope has only a
limited accuracy and stability, good observations require the your presence during
the observing run, because you have to manually optimize the pointing of the antenna
to your source.
After starting up the system, described here,
we recommend to follow this sequence:
Analysis
Let's suppose that we use Microsoft Excel to do the interpretation of the data.
Then we recommend to follow this sequence:
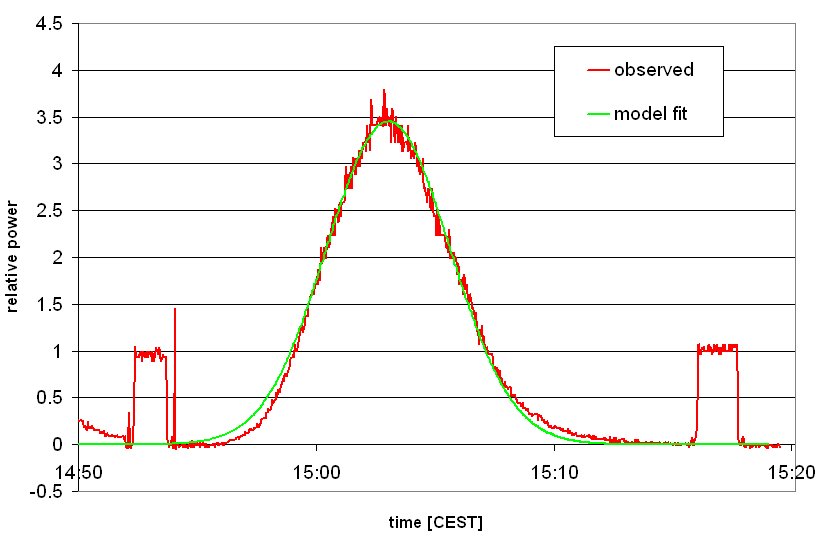
To complete the analysis, we need to determine the HPBW of our antenna. If you
have been able to obtain a full drift scan, you could simply take the last plot
and look up the times when the relative power was one half of the maximum value.
If you did a half drift scan, and you are sure that you started exactly at the
maximum signal, you could also look up the time that passed between the maximum
and one half of the maximum value, then double this time.
But the neatest way is to match a simple model to your curve:
More about our results
Below we show one of our first drift scans with proper flux calibration. As described
above, and in the Data Reduction, the raw data is corrected
for the background and calibrated. The calibration measurement on the Holiday Inn
hotel provides a temperature of about 300 K, hence the antenna temperature is 210 K.
To interpret our data, we need to understand how the measurements are related
to the physical quantities (see Fundamental Concepts
for the explanation of the technical terms):
What happens during calibration? Because the calibrator emits thermal radiation,
the true temperature of the source is equal
to the brightness temperature
Now let us consider what happens during the observation of the Sun: Again, the
approximation of solar radiation by thermal emission of a certain temperature
T_sun implies its equality with the brightness temperature
This determines our procedure:
From the full drift scan shown on the right hand side of the above overview plot,
we reduced the data which included taking into account the time changes of background
and calibration levels, and we obtained the reduced data shown below:
The HPBW is determined as 3.75°, the solar antenna temperature of 210 K, and
with a ratio of the solid angles of 56.3 the solar temperature is 11800 K. This
is the temperature of the bottom of the corona, where the plasma is sufficiently
transparent to let the 11 GHz radio waves escape. The value is in excellent
agreement with literature data.
In the course of time, we became certain that our instrument did not perform
as closely to the prototype as one could have expected. It turned out that the
arm carrying the LNB had been bent upwards, as the telescope once got thrown over
by strong wind gusts, and hence the dish was out of focus. Once the LNB arm had been
straightened, the instrument performance came close to that of the prototype.
For instance, the Sun has now a maximum signal of about 8 dB over the background
level and the antenna beam is as narrow as expected.
A full drift scan of the Sun is shown here, along with the flux calibrations:
The HPBW now is only 1.5°, the solar antenna temperature 1035 K, and
with a ratio of the solid angles of 9.3 the solar temperature is 9650 K.
However, further observations did give higher temperatures, but also different
values for the HPBW. Also, it is interesting to notice
a small asymmetry of the antenna pattern ...
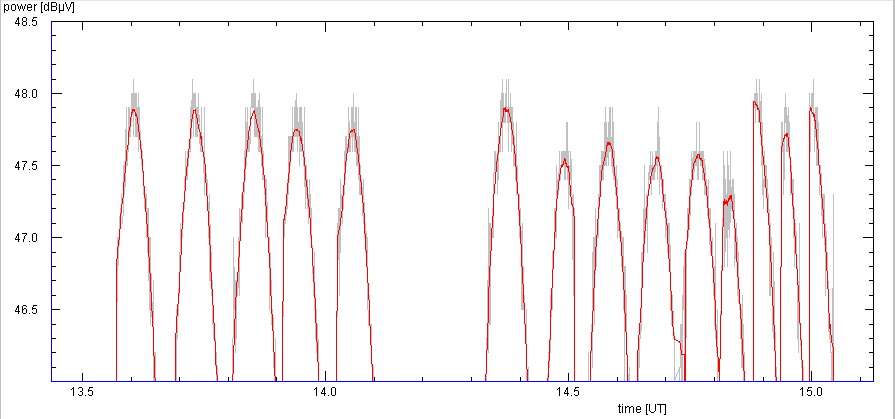
During our next observational campaign in 2008, Aikaterini Panopoulou conducted
a careful study, measuring the peak solar signal many times, and under various
weather conditions:
To capture the real peak may not be so easy: As explained above, we first search
manually for the position with the highest signal. Because of the fluctuations
of the signal, this requires some patience. Also, if we move the antenna a
bit in one direction, then back in the other direction, this does not mean
that we have returned exactly to the first position ... In the above figure
we tried to capture the solar passage many times, after each passage searching
again for the maximum signal and then going a bit to the right (and a bit
downwards) to capture the sun again. As can be seen, while the absolute maximum
is indeed just below +48.0 dBµV, several observations missed the sun by as much
as 0.5 dB! An error of that size results in an error of 1600 K or about 15 percent
in temperature!
| Top of the Page
| Back to the MainPage
| to my HomePage
|
last update: May 2013 J.Köppen
day weather temperature
14 Jan 08 sunny, partly cloudy 10261
30 Jan 08 cloudy 10897
1 Feb 08 very cloudy+windy 10516
2 feb 08 sunny, partly cloudy 11607
4 feb 08 cloudy 10501
19 feb 08 sunny 10820
29 Feb 08 very cloudy+windy 10692