- Basics on the Rotation of our Galaxy
- Radial Velocity Tool
- How to determine the Rotation Curve of the Milky Way
- Observational Procedure
- Manual observing
- Batch observing
- Analysis, Step One: Basic data reduction
- Analysis Cosmetics: Optional improvement of the data representation
- Analysis, Step Two: Get the rotational velocities
- Analysis, Step Three: Interpretation
- Analysis, Step Four: Modeling
- Analysis: Another way of looking at the l-v-map
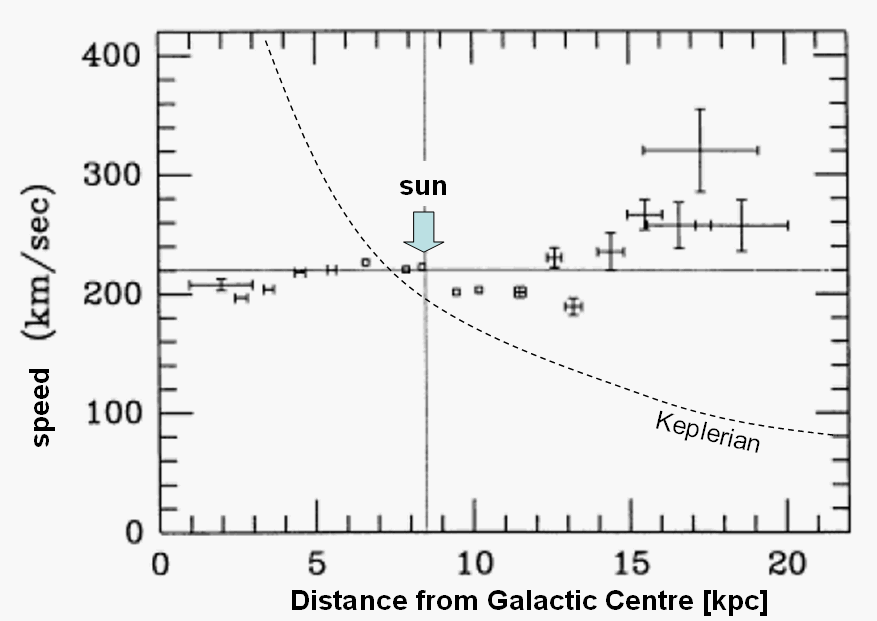
The gas and the stars that make up the disk of our Milky Way Galaxy
revolve around the Galactic Centre. This finding comes from optical
studies of stellar motions and from observations of the 21 cm
radio line which permits to measure the motion of atomic hydrogen
gas by the Doppler effect. Below we show the rotation curve of the
Milky Way, i.e. how the rotational speed depends on the distance from
the Galactic Centre.
(modified after: Fich & Tremaine 1991, Ann. Rev. Astron. Astrophys. 29, 409)
Because we observe the motions from within the Galactic Disk - the
Sun is located in the Plane at about 8.5 kpc distance from the Centre -
and the Doppler effect measures only the radial component of the
velocity, the structure of the observed data is a bit complicated.
The JavaScript Radial Velocity Tool visualizes how we
perceive the true
galactic motions. Here are basic explanations:
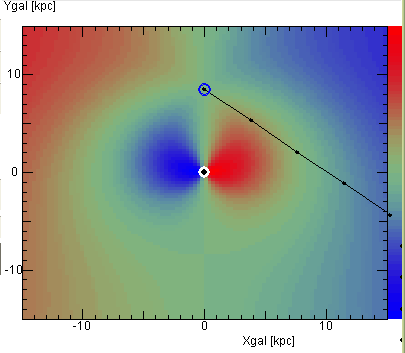
The image below shows a map of the radial velocity which every part
of the Galactic Disk appears to have as seen from the Sun. Since the
Sun also participates in the rotation, we observe only differences in
radial speed. Regions coloured in red appear to be receeding from us,
hence the line is redshifted (i.e. to frequencies below the theoretical
frequency); blue regions appear to move towards us (blueshift). The
intensity of the colour is a measure of the apparent radial velocity.
Emission from the greenish-greyish regions is seen without any lineshift,
it appears to move with the same speed as ourselves.
If we look in a certain direction in the Plane - the black line in the
above image indicates this line of sight at galactic longitude of 50°,
with small dots indicating distances from the Sun (every 5 kpc) -
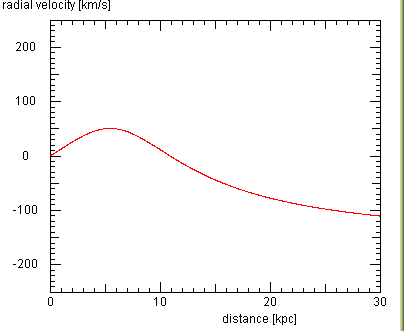
the radial velocity of a parcel of gas depends on the distance from the
Sun to that gas:
One important feature is seen here: for the gas inside the solar orbit
the radial velocity has a maximum value. The dependence of this maximum
on galactic longitude permits to derive the Galactic Rotation Curve
(cf. below). But the
fact that for each value of the radial velocity there are two distances where
the emitting gas could be, makes it a bit difficult to locate this gas.
This problem does not exist for the regions outside the solar orbit.
How to determine the rotation curve of our Galaxy
With the ESA-Haystack radio telescope we can derive the rotation curve
of the Galactic Disk by obtaining spectra at positions in the Galactic
Plane for galactic longitudes up to 90°, measuring the radial velocities
of the hydrogen gas, and using the trick of the maximum velocity to infer
the rotational speed at various distances.
Observational Procedure
Since only galactic longitudes up to 90° are of use for us, it is best to
check whether this part of the sky is above the horizon ... BEFORE going
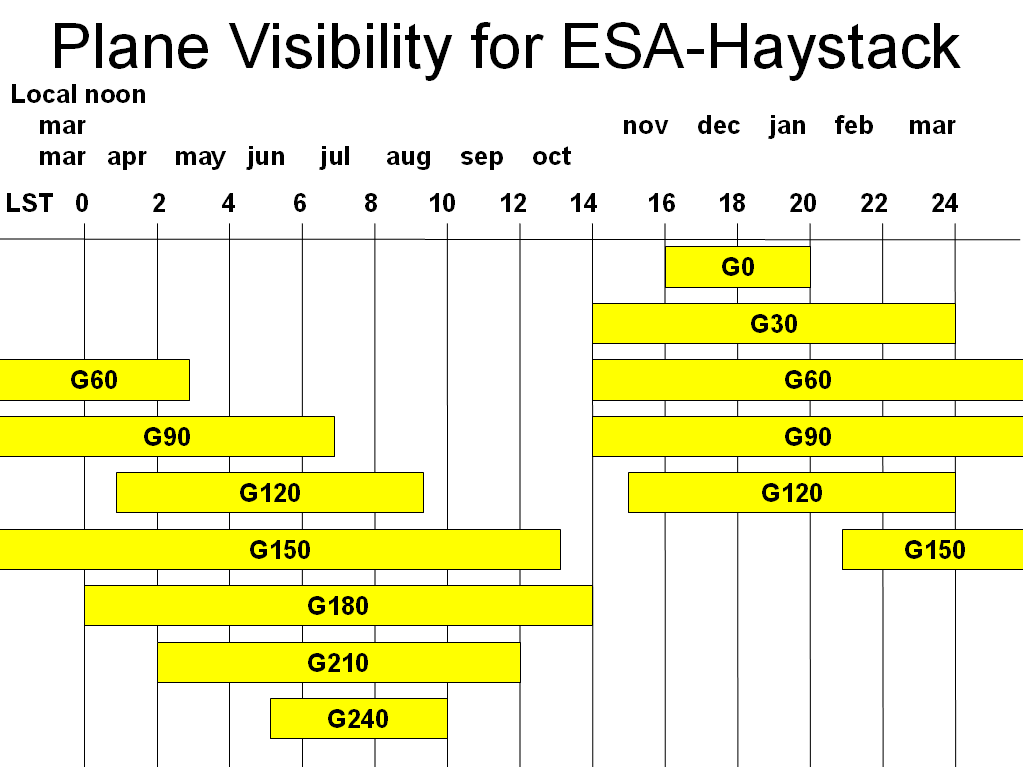
to the observatory room! This graph shows when positions in the Galactic
Plane are accessible:
Once you started up the system, as described here
you are ready to observe. There are two ways to get the observations done.
We recommend to do them first manually. This direct interaction will make
you more familiar with the instrument and will teach you how to use it well.
On the graphical interface, watch the waterfall plot. The variation you see
between each line should be slight and is due to the fluctuations of the
noise in the signal. You may click on the yellow fields to adjust the range
of the values represented by the colours. Since the galactic emission is
concentrated to a narrow frequency range, you should be able to discern
eventually a vertical band of slightly higher signal. This is also seen in
the frequency plot to the upper centre: the black curve shows the current
spectrum, the red curve is the accumulated one, so that after a while the
galactic features would become more distinct. After you had tried the
manual observing, we will encourage you to run batch files while you are
in class or doing other things. This will allow for much easier,
less tedious data acquisition and hopefully permits you to accumulate
as much data as you may need.
Manual Observations:
You may wish to observe also positions with longitudes in between those marked
(usually in 10° intervals). You can do this, but it needs adding or modifying
sources in the software's catalog file. This is not terribly complicated and it
can even be done during an observation run ... but please think of other users
of the telescope, and after your run, please remove or undo your changes!
Batch Observations:
Unfortunately, during summer, the galactic positions interesting for the rotation curve
are only above the horizon at night. Therefore,
Analysis, Step One: Basic data reduction
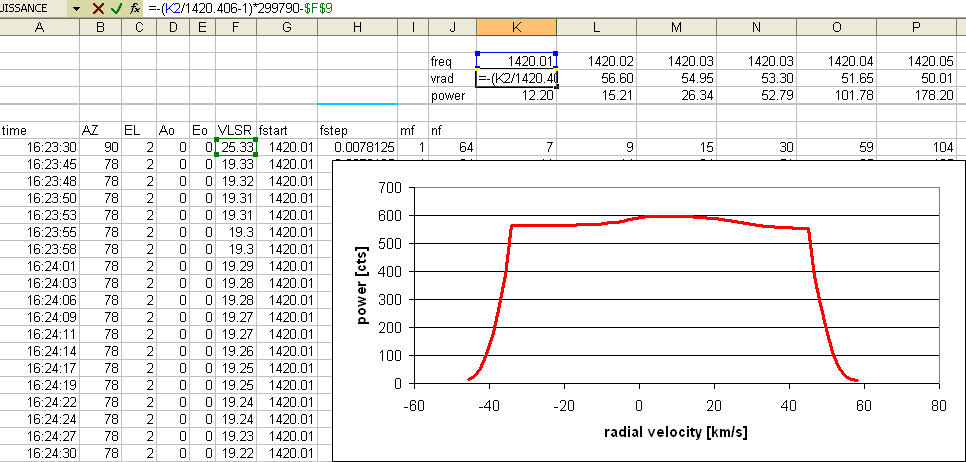
Let's suppose that you use Microsoft Excel to do the interpretation of the data.
Then we recommend to follow this sequence (see also here):
Analysis Cosmetics: Optional improvement of the data representation
Often it is advantageous to improve the appearance of the galactic features by subtracting
the baselines from the averaged spectra of each galactic longitude. As described
here it requires inspection of each spectrum
as to find the best way to fit a baseline to the background, and then to subtract these
constant or interpolated baseline fluxes from the spectra to give the spectra of only
the galactic feature:
Analysis, Step Two: Get the rotation velocites
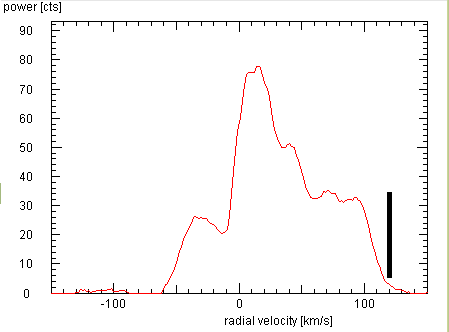
The next step is to determine for each of your observed positions the maximum radial
velocity, by looking at the averaged spectra. These values permit you to derive the
rotational speed in the Milky Way at various distances from the Centre.
This is how it is achieved:
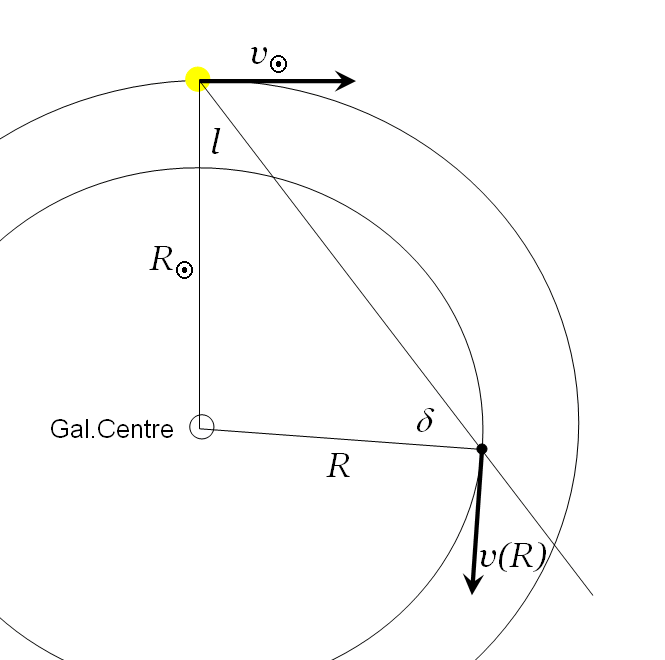
Let us assume - as in the JAVA applet - that all parts in the Galactic Disk are moving
in circular motion around the Galactic Centre, and that the rotational speed depends in some
way on the distance from the centre. If we look from the Sun into the direction
of galactic longitude l we observe on our line of sight a parcel of gas with radius
R from the centre, we measure its radial velocity with respect as its circular
velocity v(R) projected on the line of sight, with the projected velocity of the
Sun subtracted:
This is the crucial formula which transfoms our measured values Vmax (l)
determined for each longitude l into the rotational speed v(R)
at the galactocentric distance R = Rsun * sin l .
Let's do it:
We may take the standard accepted values for the Sun: Rsun = 8.5 kpc and
vsun = 210 km/s and put our measured maximum radial velocities in a
small table (in Excel) - with the data from 24 mar 2010 -
Analysis, Step Three: Interpretation
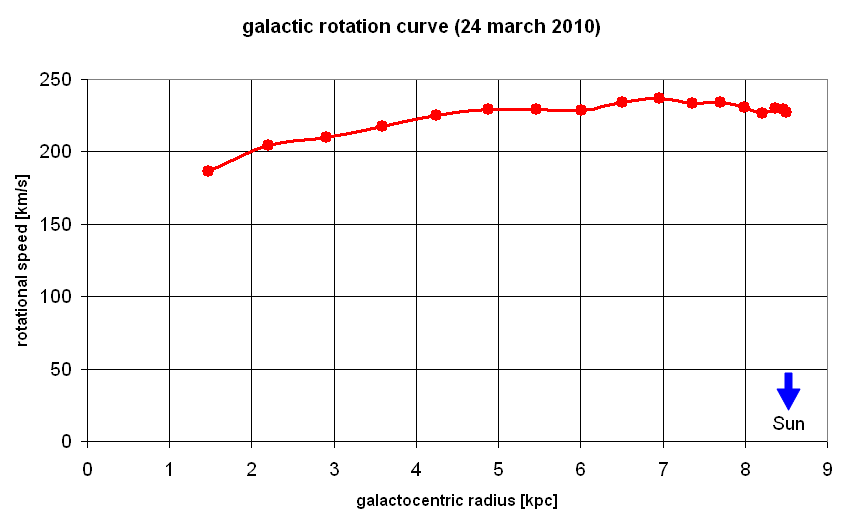
We now plot the rotation curve - rotational velocity as a function of distance R
from the centre. This simple plot shows one of the great problems of
our present knowledge:
Analysis, Step Four: Modeling
If you want to compute the rotation curve from a mass model of the Galaxy
and explore yourself the possible explanations, here you can download
instructions for modeling in Excel.
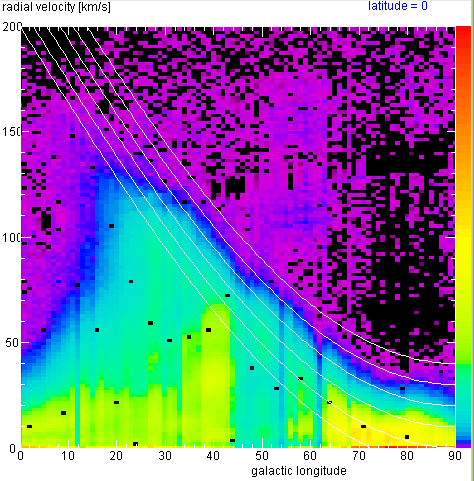
Analysis: Another way of looking at the l-v-map
We may also obtain a direct interpretation of the longitude-radial velocity map
by superposing the curves of constant rotational speed: Using the formula that
gave us the maximum radial speed
| Top of the Page
| Back to the MainPage
| to my HomePage
|
last update: Nov. 2010 J.Köppen
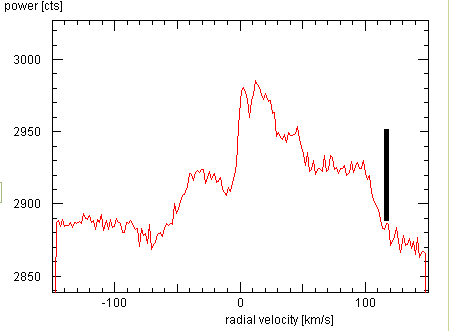
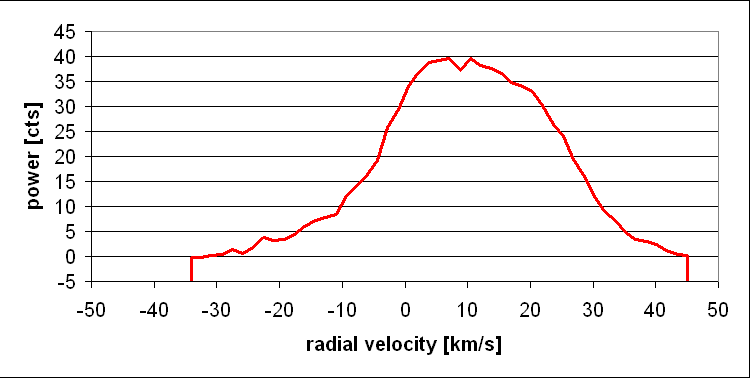
For example, the averaged spectrum at G30 looks like this (on 24 mar 2010, with 30 min
observing time, resulting in about 140 spectra ... this shows that our system isn't quite
optimal yet). While using the frequency as abscissa would also do, it is much better
to use radial velocity:
Gal.Long. vsun*sin l Vmax v(R) R=Rsun*sin l
10 36.5 150 186 1.48
20 71.8 138 209 2.91
30 105 120 225 4.25
40 135 94 229 5.46
50 160.9 73 234 6.51
60 181.9 52 234 7.64
70 297.3 33 230 7.99
80 206.8 23 230 8.37
90 210 17 227 8.5
