Solar Drift Scans
Joachim Köppen, Strasbourg, 2011/12
Observations
Follow the procedures to
switch-on the ESA-Dresden telescope
- Goto Calibrator and Start Observe & Record;
measure here for about 5 min
- Sun now then Goto
- When telescope reached position, manually move it to get the
maximum signal. The position may deviate by about 1° in elevation
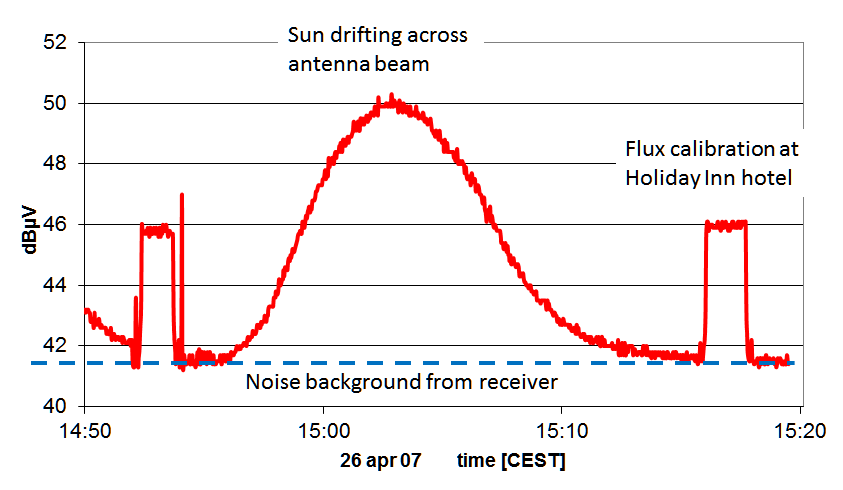
and as much as 3° in azimuth. The maximum reading is about +48 dBµV.
If you want to make a full drift scan (may need luck, takes 30 min):
- Determine the offsets in AZ and EL between this maximum and the
predicted sun position. Apply these offsets to the predicted
position which appears after one clicks Sun+15min
- Goto this position. Note the present reading which is
the sky background. Then wait ...
- As the sun drifts through the antenna beam, the signal hopefully
rises up the previously found maximum value. Keep observing until
the signal has gone down and is constant again
- Measure the constant level for some minutes (the second measurement
of the sky background), then
- Finish by Goto Calibrator; stay there 5 min, and then
Stop & Finish the observation run

If you want to make a half drift scan (is safer, takes 15 min),
- From the movement of the sun, you can guess where it will go:
always right, but up or down. Therefore, move manually by
touching the keys of the rotrator controller just briefly!
The signal should now be about 1 or 2 dB lower
- As the sun drifts through the antenna beam, the signal hopefully
rises back to the maximum, and then goes down. Keep observing
until the signal has become constant
- Measure the sky background and the Calibrator again
- Stop & Finish the observation run
Interpretation (more details):
- Import the text file with the data into Excel
- Convert all the dBµV values into linear units (P = 10^(dB/10))
- Determine the average power from the calibrator: Pcal
- Determine the average power for the empty sky: Psky
- Convert all powers into antenna temperatures:
Tant = 290K * (P-Psky)/(Pcal-Psky)
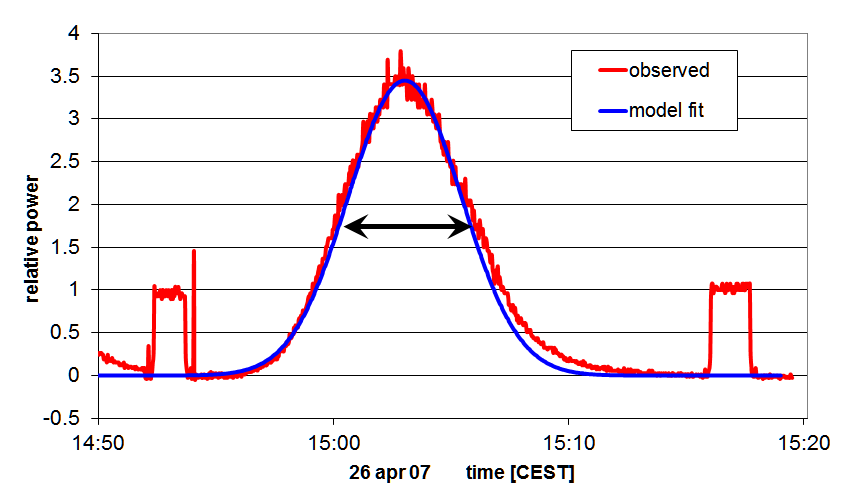
- Plot the antenna temperature as function of time (scatter plot)
- Make sure that the measurements of the sky average about zero
temperature, while the calibrator measurements are around 290 K.
If not, adjust Psky and Pcal
- Determine the times at which the bell-shaped curve of solar
measurements reaches the half its value at maximum.

- Convert this time span into the angle that the sun had moved.
This is 15°/min*cos δ with the present declination δ
of the sun ( e.g. from here).
- This angle is the Half Power Beam Width of the antenna.
From this we can compute the solar flux and compare it to other
measurements:
- The antenna beams solid angle is Ω = π/4 * (HPBW*π/180°)²
- This gives its effective area: Aeff = λ²/Ω
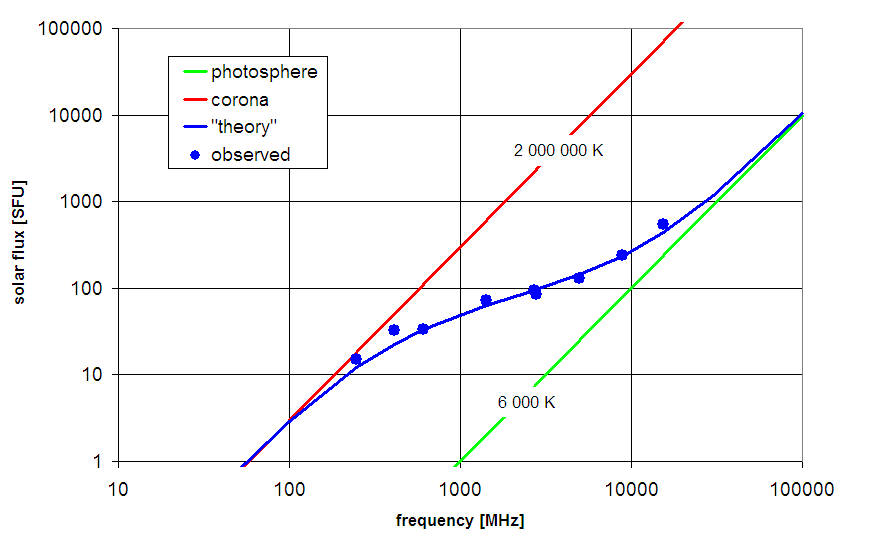
- The flux F = 2kTant/Aeff can be compared with the data for that
day and frequency published by NOAA
(note that 1 SolarFluxUnit = 10000 Jy).

The final step is to derive the temperature on the solar surface:
- From here
one gets the angular diameter of the sun: D.
- The filling factor with which the sun fills the antenna beam is
given by: (D/HPBW)²
which allows the compute the surface temperature from the
maximum antenna temperature
Tsun = Tant_max * (D/HPBW)²
| back to Main page
| ESA-Haystack Radio Telescope (1.4 GHz)
| ESA-Dresden Ratio Telescope (10GHz)
| to my HomePage
|
last update: Sept. 2011 J.Köppen
