MS2 UE7e: Introduction to Radioastronomy
Joachim Köppen, Strasbourg, 2012/13
This is a rather experimental course, so here is the
plan (let's see how it works :-) ...
pdfs of the lectures
Summary of Observations in 2011/12
Summary of Observations in 2012/13
NOAA: Solar Radio Flux Data
Homework (please return by as soon as possible for you):
- Each of you compiles a report of the observations of 24 jan, the analysis,
and the results.
- At the present time, the ESA-Haystack telescope undergoes repairs.
Since I do not know whether I can get it working before our observation
run, you might not obtain your own observations of the Milky Way,
but I have plenty of original data which you can use ... we'll see!
Notes on observing projects
Notes on projects with archive data
- Lunar Drift Scans (10 GHz): Since the moon is a faint object, observing
it is quite tricky and need time and experience. Therefore we may not
be able to succeed in this challenge. But there are data in the archive.
The analysis is very similar to that of
Solar Drift Scans, except that one takes
the antenna's HPBW = 1.7°, known from solar scans. The result will be
the temperature on the surface of the moon. It is also a good idea to
check the lunar phase.
- Rotation Curve of the Milky Way (1.4 GHz): this has the same aim
as above, but using data from the archive.
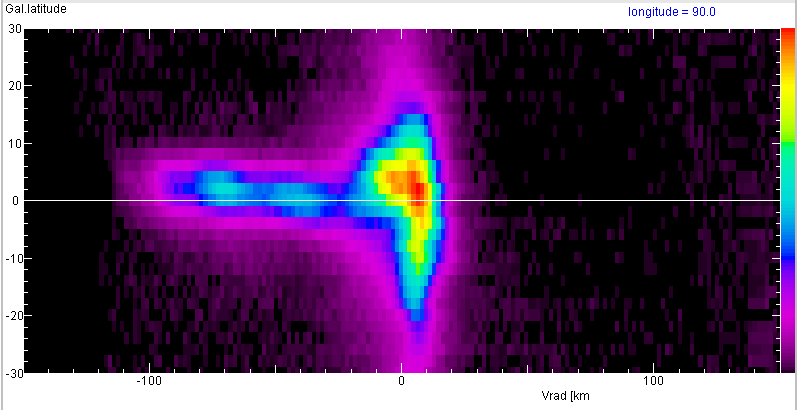
- Warping of the Milky Way Disk (1.4 GHz): The outermost spiral arm seen
at G90 (at -72 km/s) lies above the Galactic Plane:
 Use the data accessible from the
Third Illkirch Survey of Galactic Hydrogen
to trace this arm in the other longitudes, to work out its positions,
and get a 3D view of the arm.
The data on the spectrum at any latitude is obtained by
clicking plot (to show the spectrum), then Output. The
data can be copied and pasted into any text editor.
- Hydrogen in the Solar Neighbourhood: The image above shows that
hydrogen emission near 0 km/s extends also above and below
the Galactic Plane. This gas is moving with the sun, thus it belongs
to our neighbourhood. Use the data accessible from the
Third Illkirch Survey of Galactic Hydrogen
to find out its distribution around us, i.e. with galactic longitude.
- Improvement of S/N ratio by Averaging: To beat the receiver noise in
the ESA-Dresden telescope, we do not take a single measurement, but
always take as many as possible and then compute the average value.
For Gaussian noise, one would expect that the signal-to-noise ratio
improves with the square root of the number of data. This can be studied
in various ways:
- Take one or a few files from the archive data which show long
portions of the constant calibrator signal, and compute the amplitude
of the fluctuations, as a function of length of the data.
- Likewise, one can make a histogram of the data values ... to inspect
the distribution function of the noise
- Observe with the telescope the same position (calibrator or the
empty sky (on a clear day!)) as long as possible.
- Improvement of S/N ratio by Stacking: To beat the noise in a telescope,
we take a number of spectra at the same position, and stack them together.
For Gaussian noise, one would expect that the signal-to-noise ratio improves
like the square root of the number of data sets. It this true for our spectra
from the ESA-Haystack? Take one or a few files from the archive data,
and determine the amplitude of the fluctuations, e.g. in a part of the
spectrum far from the galactic emission. Do this for several single
spectra, and for sum spectra composed of different numbers of
spectra. How does the amplitude of the fluctuations decrease with the
number of spectra?
Observational Data
| ESA-Haystack Radio Telescope (1.4 GHz)
| ESA-Dresden Ratio Telescope (10GHz)
| to my HomePage
|
last update: Jan. 2013 J.Köppen